Monitoring
Currently, Conduktor provides only a few features from the metrics system. We only handle the metrics when the Kafka brokers expose their metrics using JMX or Jolokia (JMX over HTTP).Configuration
In your Cluster Configuration, you can enable either JMX or Jolokia access for Conduktor to access the metrics.JMX
JMX is a common protocol used in Java applications to expose metrics. Apache Kafka is a Java application, and exposes naturally tons of JMX metrics.JMX is not an HTTP protocol, it cannot be accessed through an Internet browser
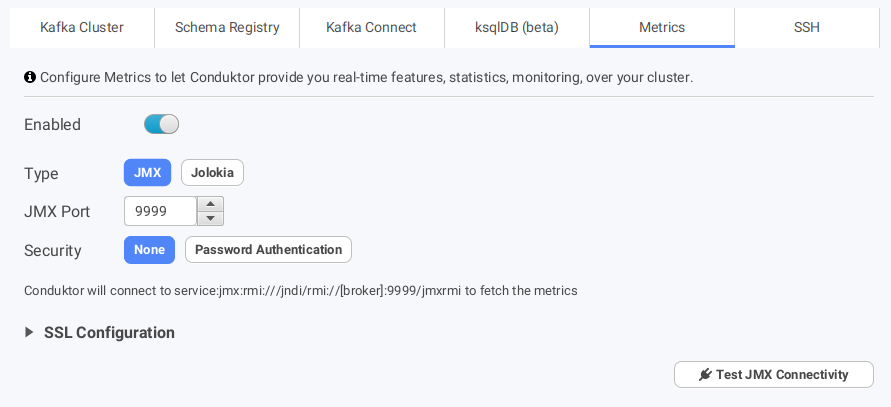
<broker advertised listeners>:9999, using the JMX protocol
The <broker advertised listeners> are NOT the bootstrap address you have configured in Conduktor to connect to your Kafka cluster. These things are entirely different, this is a specificity of how Kafka works. Please refer to understanding-kafka-listeners if you have no idea what we are talking about.
Therefore, your computer must be able to connect to this address:port for Conduktor to fetch the metrics.
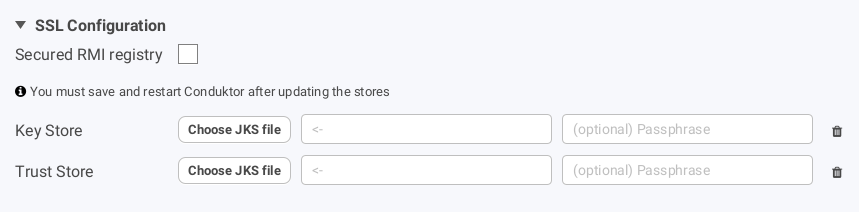
Conduktor also supports connecting to JMX endpoints and registries through both one and two-way SSL.
Jolokia
Jolokia is a technology to expose a HTTP server to access JMX metrics over a simple HTTP request. It’s often started as a Java agent directly on the main Java program. When Jolokia starts, it starts an HTTP server on a configurable port (default: 8778).This is the power of Jolokia. Because it exposes the metrics through HTTP, they are accessible
through an Internet browser
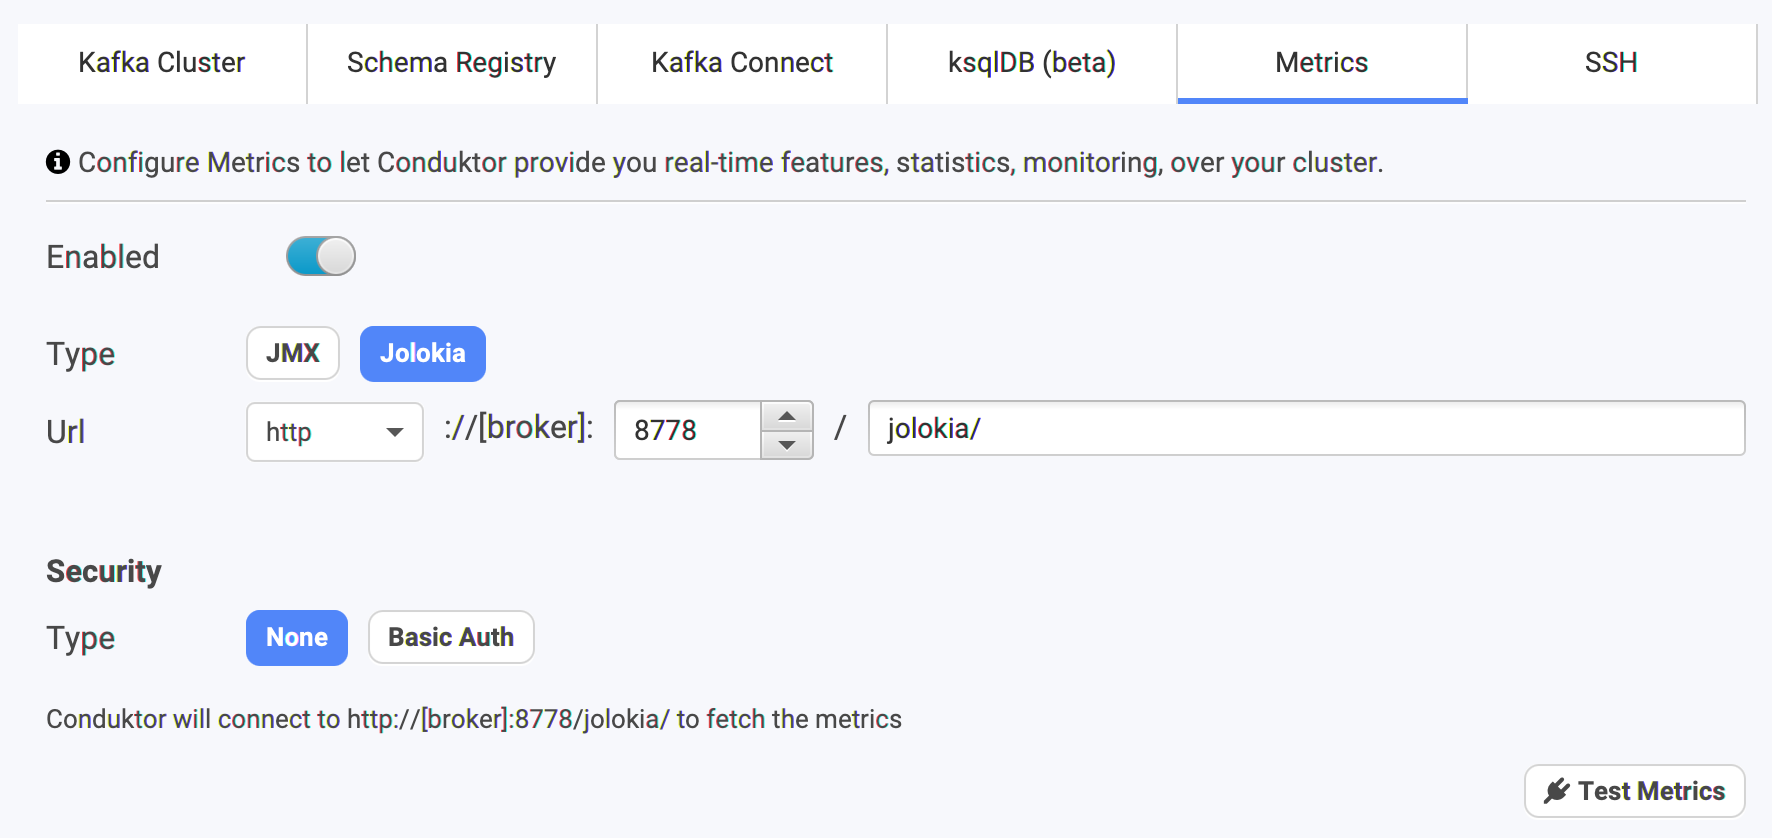
<broker advertised listeners>:8778/jolokia
<broker advertised listeners> are NOT the bootstrap address you have configured in Conduktor to connect to your Kafka cluster. These things are entirely different, this is a specificity of how Kafka works. Please refer to understanding-kafka-listeners if you have no idea what we are talking about.
Therefore, your computer must be able to connect to this address:port for Conduktor to fetch the metrics.
Usage in Conduktor
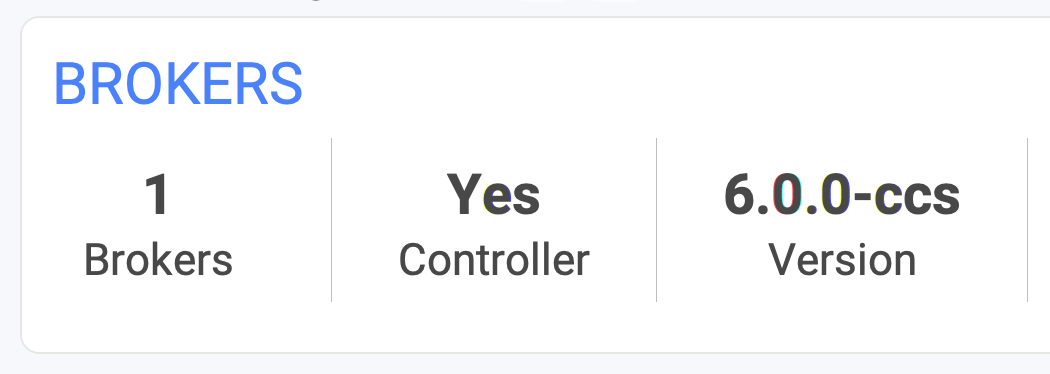
For now, Conduktor barely used the power of the metrics. We’re working to expose common metrics to monitor as graphs and notify you if sometimes looks wrong.- Version: without metrics, Conduktor can only apply some heuristics to determine the version of the brokers. With metrics, we can know exactly which one it is!
- It’s important to be sure that all your version are up-to-date and similar
- Topic throughput: we display the throughput (in/out). Useful to know the activity of a topic. Does it have many consumers, or many producers, or none?

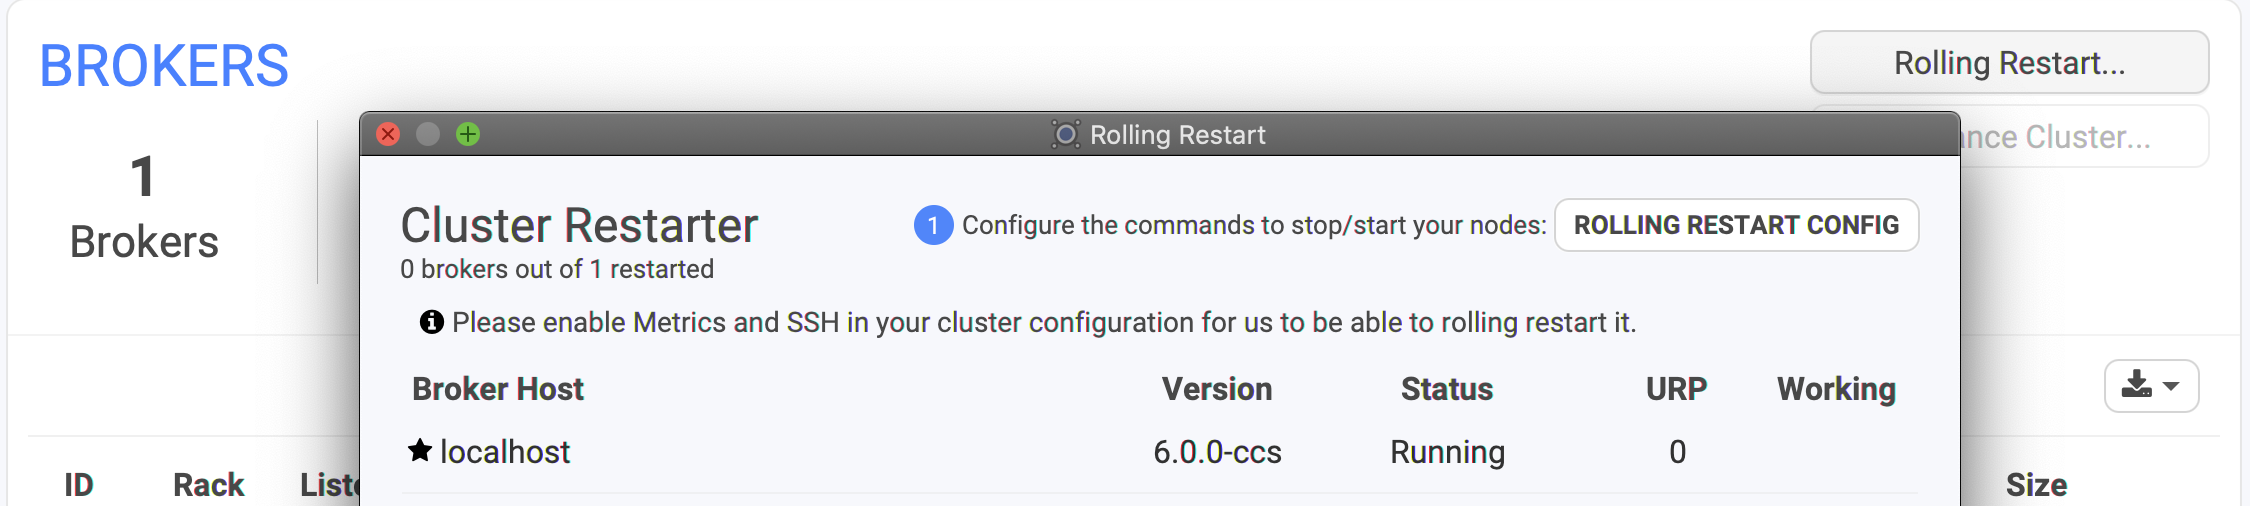
- Rolling Restart
- This is an ops oriented feature, only available when you host your own Kafka and when Conduktor can ssh into the machines.
- The metrics are necessary to monitor the Under Replicated Partitions
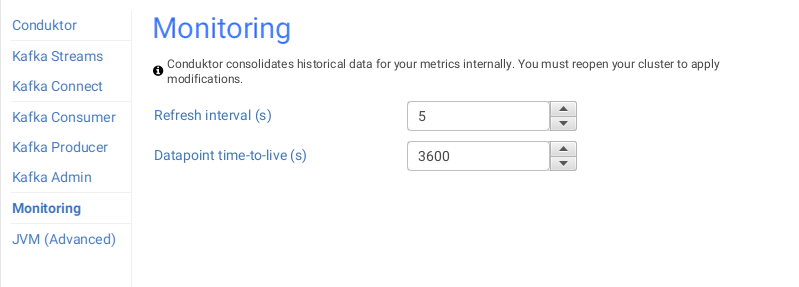
Configuring Conduktor
Conduktor has a few configurations related to Monitoring, accessible from Options > Settings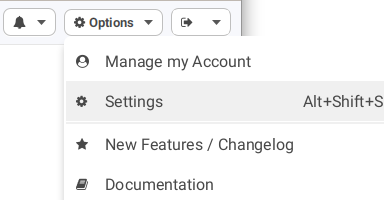
More to come
- Add Prometheus support
- A Monitoring dashboard with graphs to monitor well-known metrics
- Alert you within Conduktor in case of metrics issue detection
- Integrate the topic metrics into other screens