> ## Documentation Index
> Fetch the complete documentation index at: https://docs.conduktor.io/llms.txt
> Use this file to discover all available pages before exploring further.
# Stream lineage
> Visualize how data flows between Kafka topics and the service accounts that produce or consume them.
## Overview
Stream lineage shows the flow of data through your Kafka estate, mapping the producers, consumers, and topics involved in each stream. Use it to:
* Trace how a topic is being read and written across applications
* Identify which service accounts depend on a given topic
* Investigate the downstream impact of a topic or application change
Lineage is derived from the Kafka ACLs granted to each service account. If you use Self-service, those ACLs are generated from your `ApplicationInstance` and `ApplicationInstancePermission` resources (including approved Topic Access Requests), so the resulting lineage reflects the applications and permissions you've modeled in Console.
On Confluent Cloud or Confluent Platform clusters configured to use role bindings instead of ACLs, the edges of the lineage graph are populated from those role bindings. See the guides for migrating to role bindings on [Confluent Cloud](/guide/tutorials/migrate-confluent-cloud-rbac) and [Confluent Platform](/guide/tutorials/migrate-confluent-platform-rbac).
## Lineage view entry point
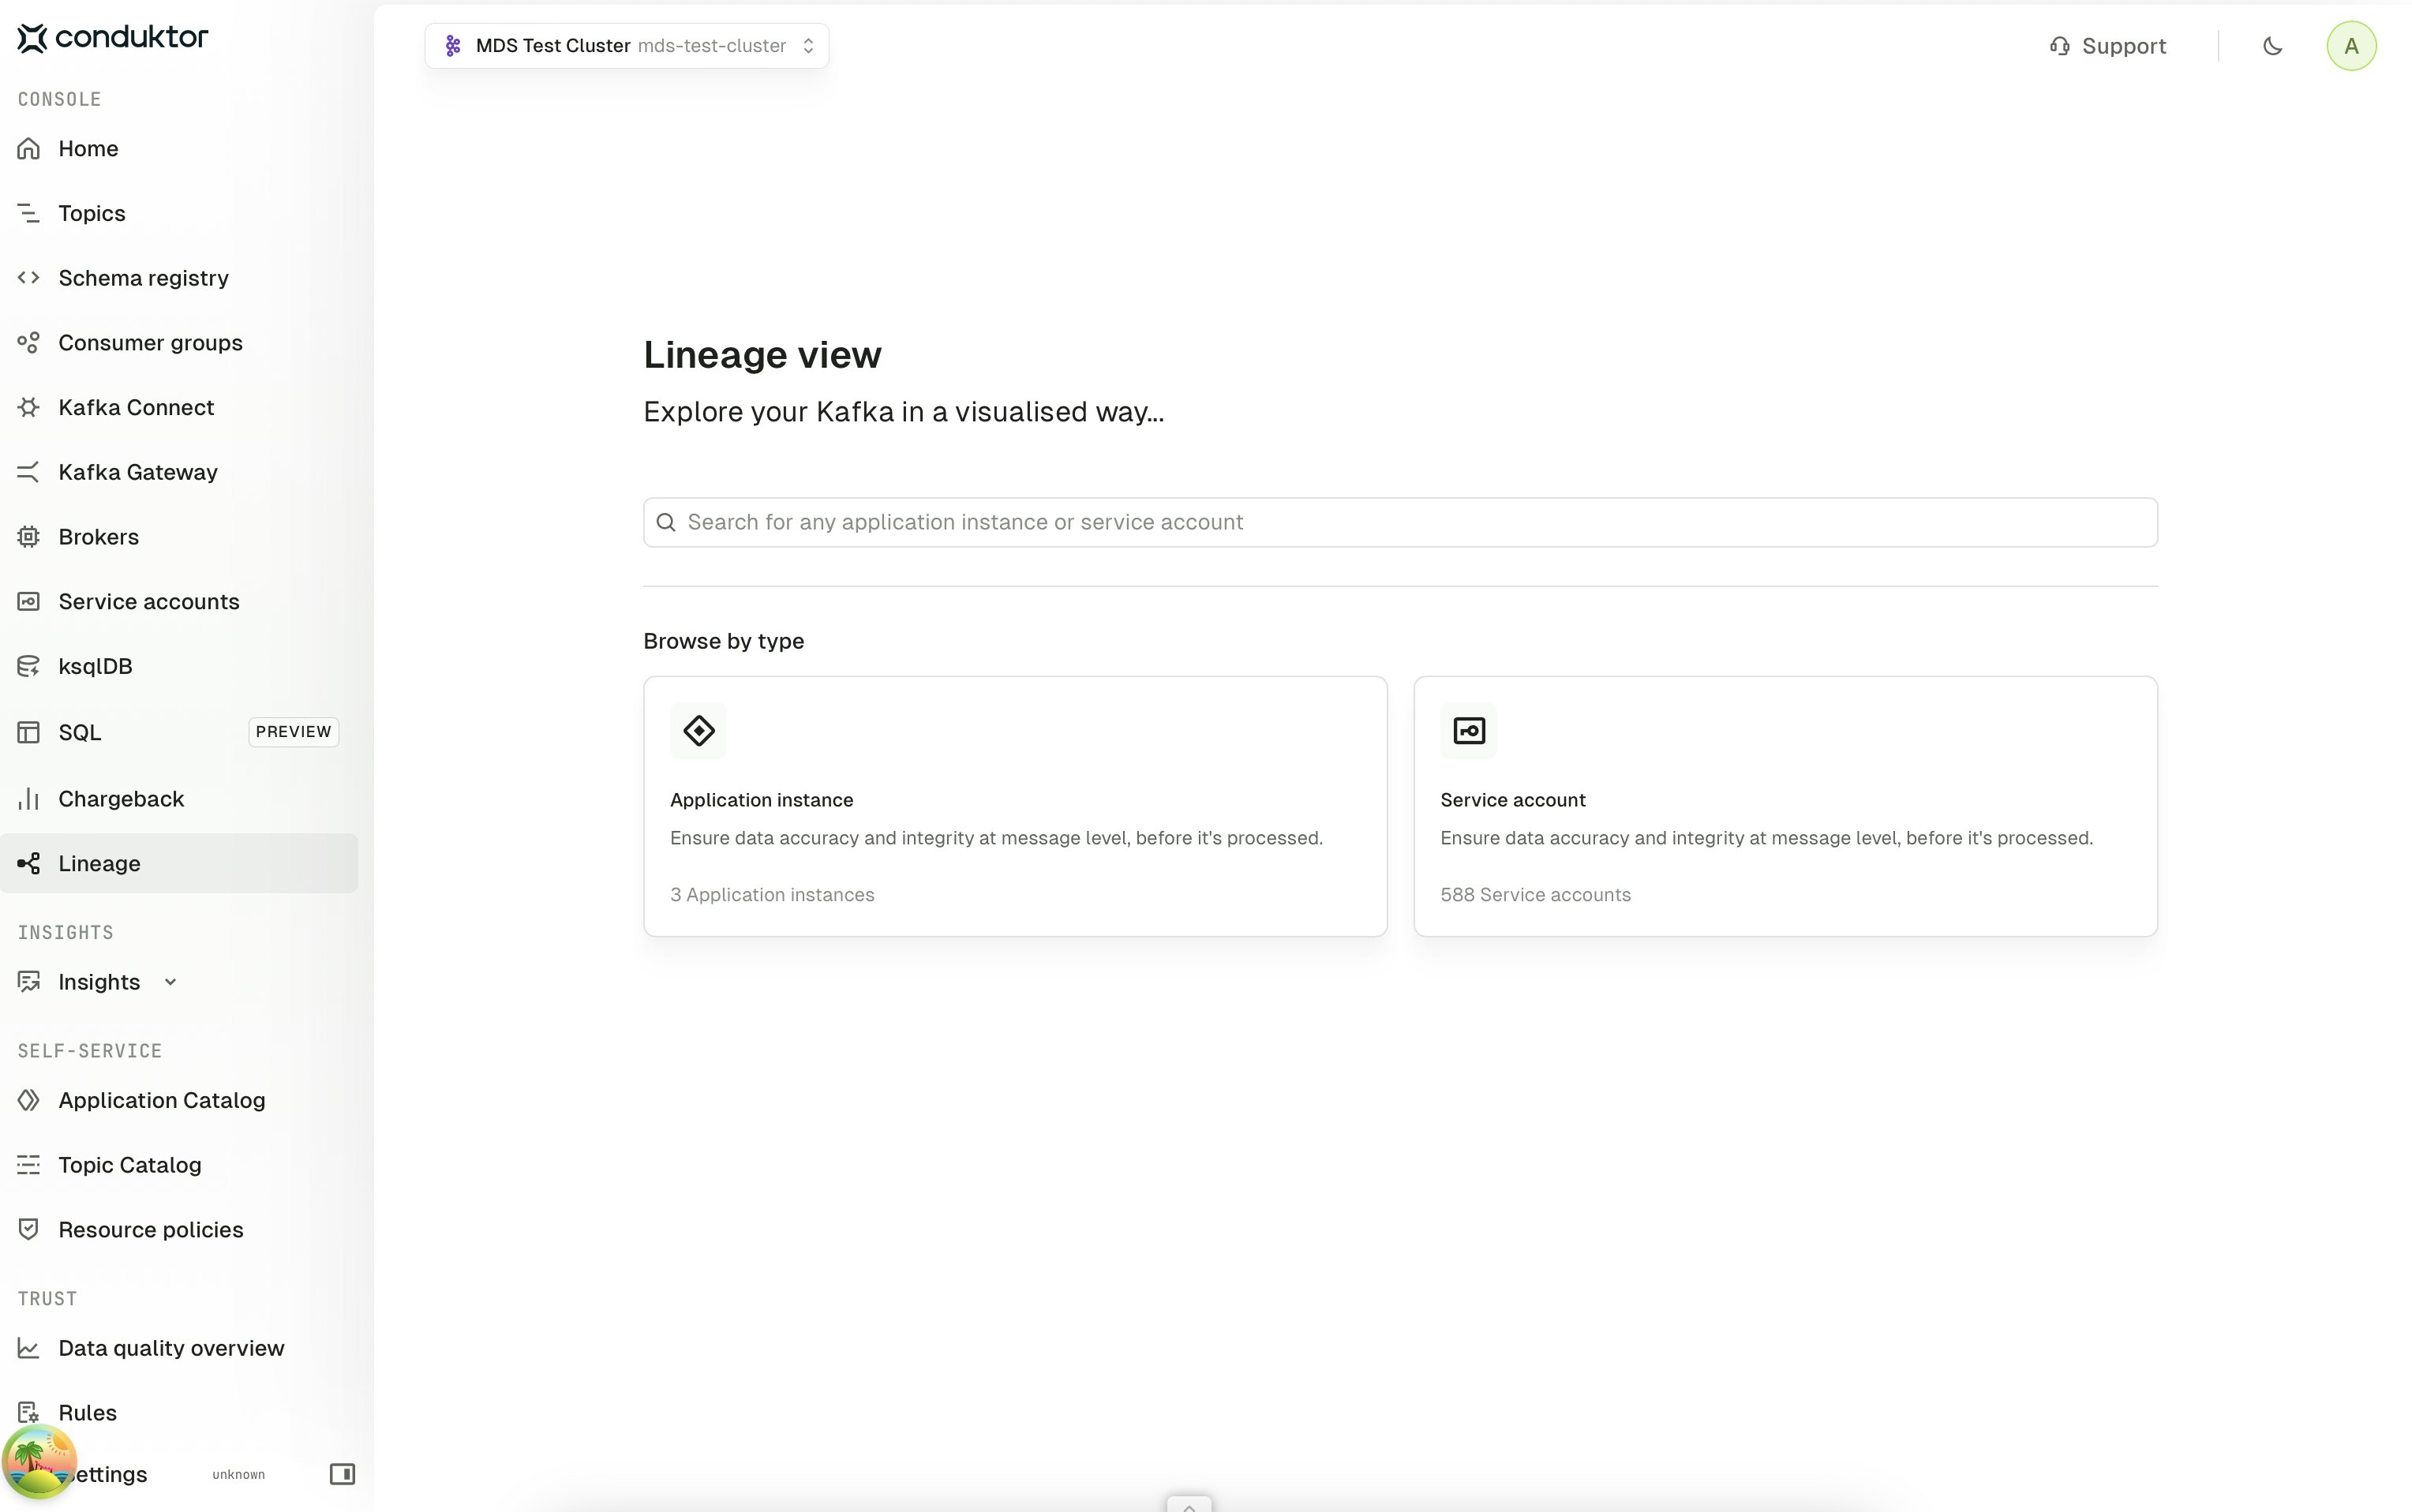
Open **Lineage** from the Console sidebar to land on the entry point for the selected cluster. From here, choose which dimension of your platform's data flow you want to explore:
* **Application instance** — view the flow built from Self-service data, with `ApplicationInstance` resources as the nodes
* **Service account** — view the flow built from the underlying Kafka authorization data (ACLs, or role bindings on Confluent Cloud and Confluent Platform), with service accounts as the nodes
The search bar at the top lets you jump straight to a known Application instance or service account without browsing.
 ## Application instance view
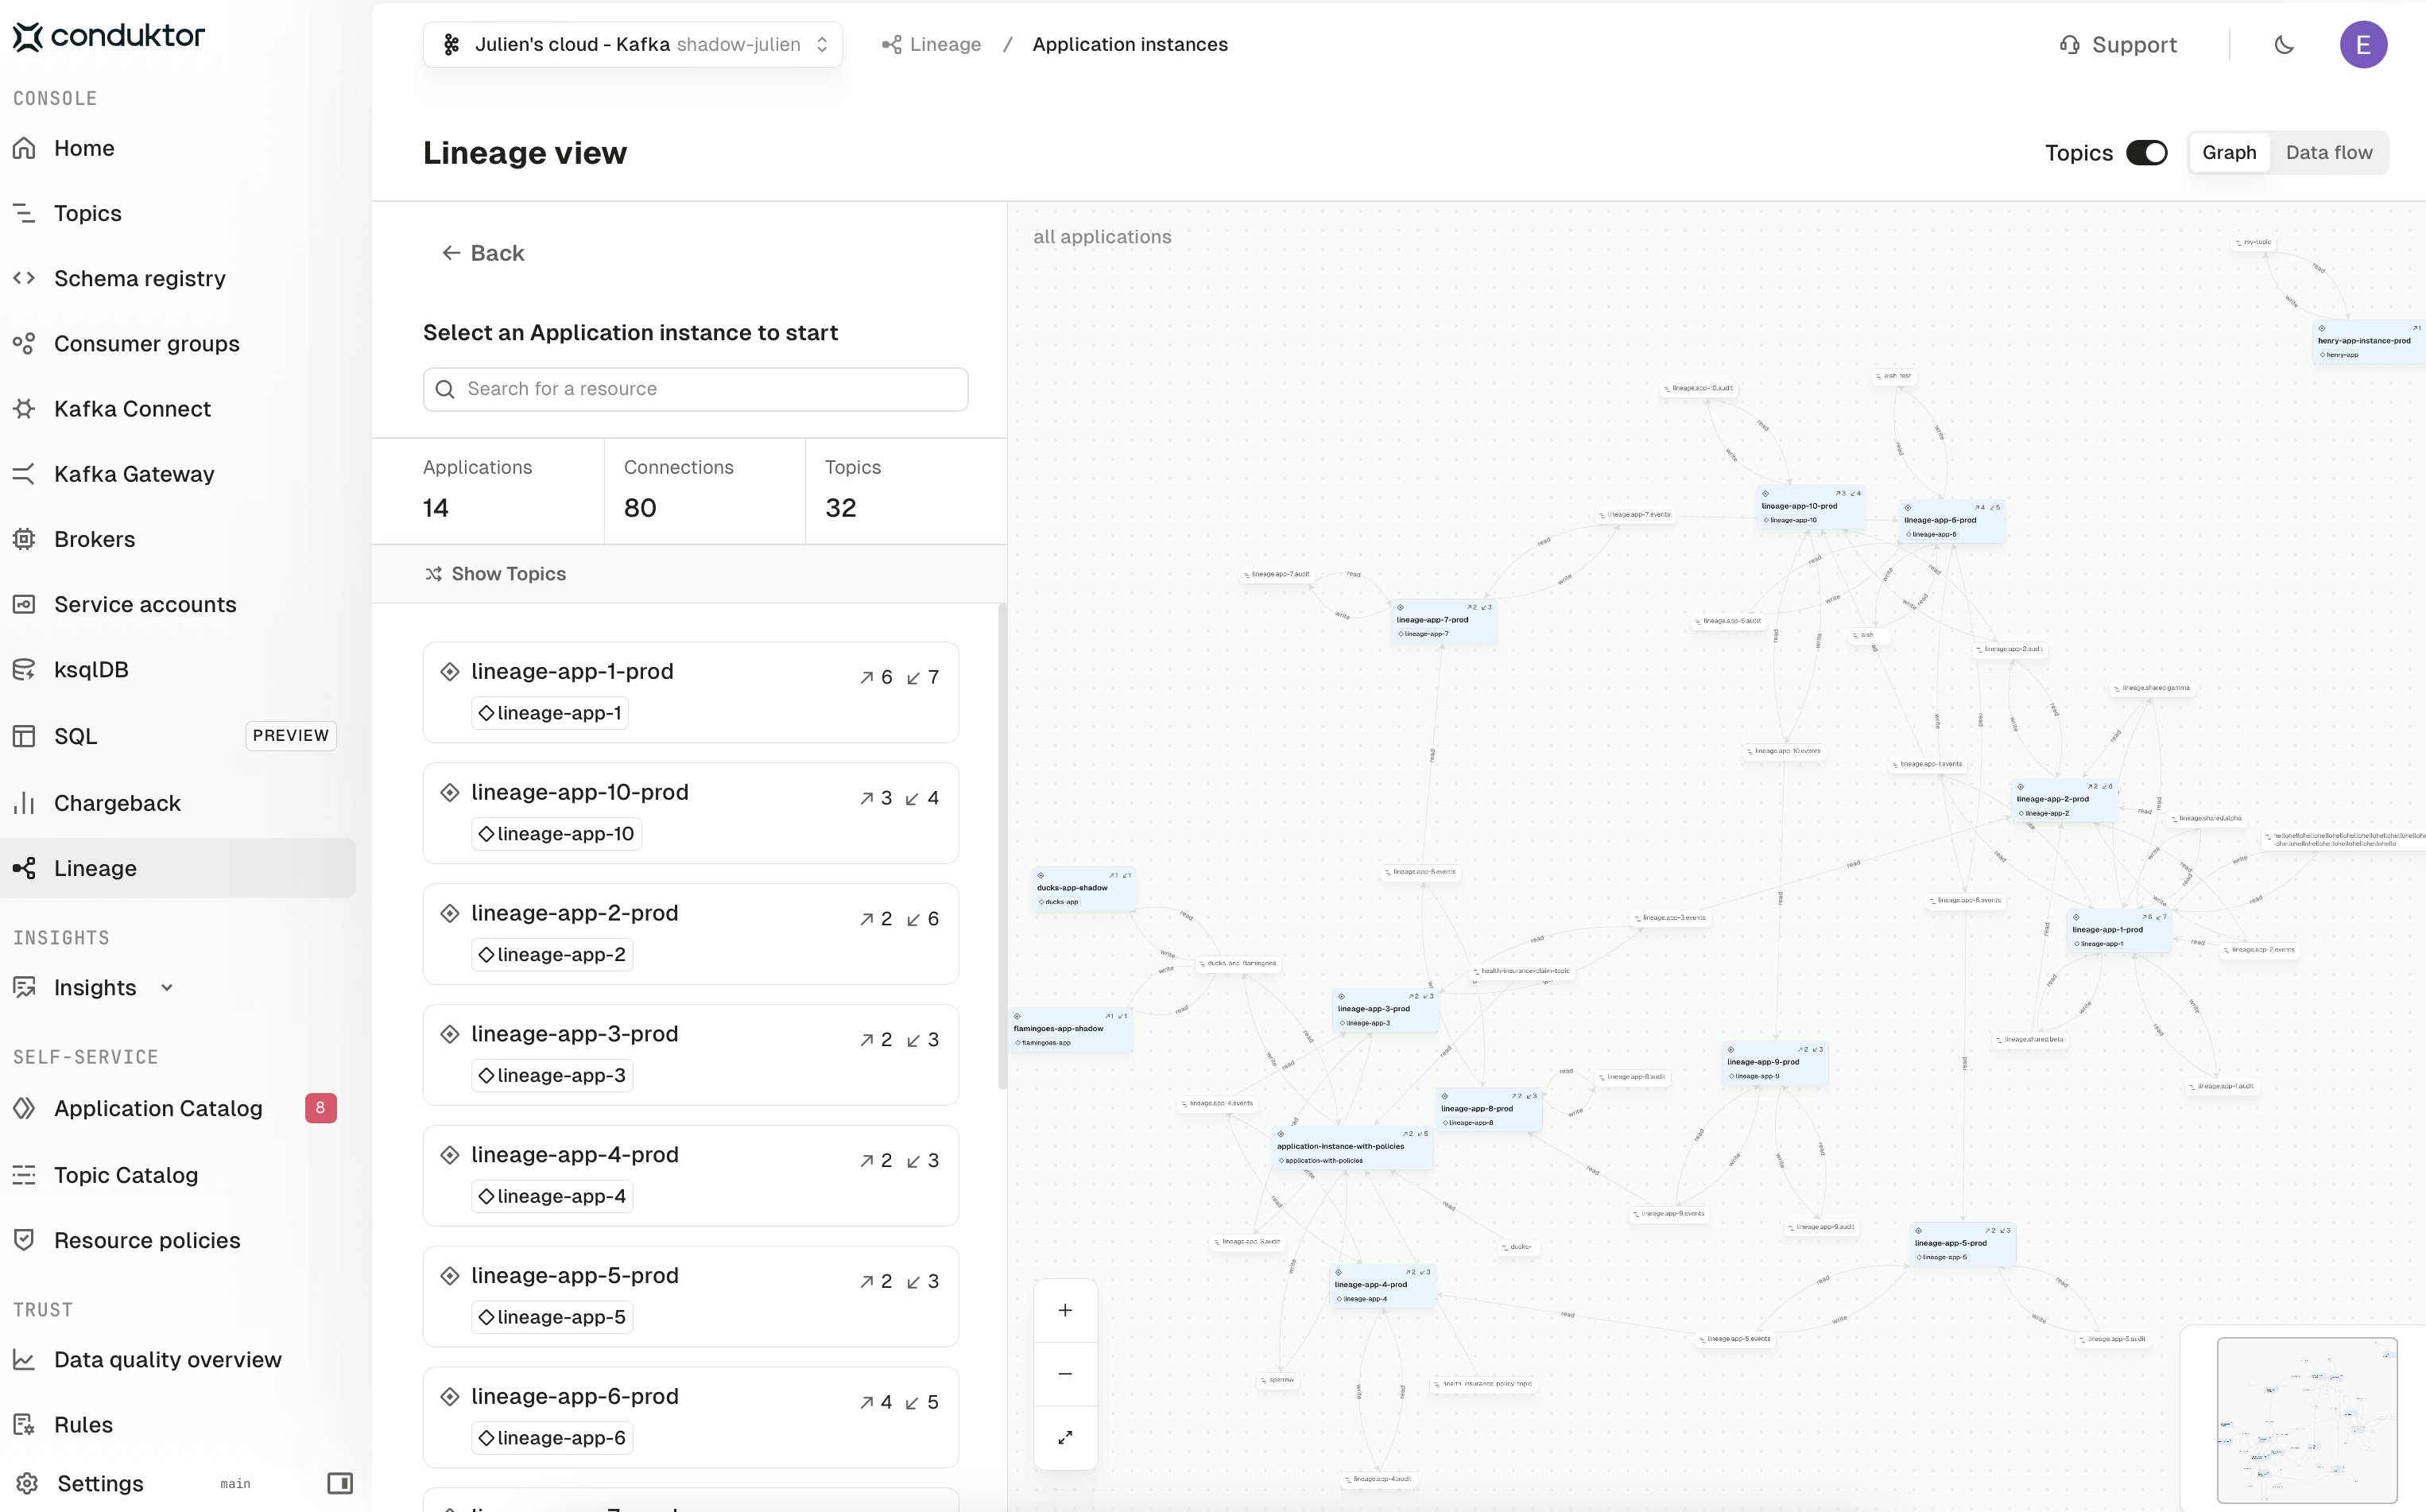
The Application instance view shows how your Self-service applications connect to one another through the topics they produce to and consume from. Each card on the left lists an instance with its read and write counts; selecting one focuses the graph on that instance and its neighbours.
The **Topics** toggle in the top right controls how connections are rendered:
* **On** — every topic that links two applications is shown as a node on the graph, so you can see exactly which topics carry data between services
* **Off** — topics are hidden and the graph collapses to a compressed view showing only how applications are transitively connected through any shared topics
## Application instance view
The Application instance view shows how your Self-service applications connect to one another through the topics they produce to and consume from. Each card on the left lists an instance with its read and write counts; selecting one focuses the graph on that instance and its neighbours.
The **Topics** toggle in the top right controls how connections are rendered:
* **On** — every topic that links two applications is shown as a node on the graph, so you can see exactly which topics carry data between services
* **Off** — topics are hidden and the graph collapses to a compressed view showing only how applications are transitively connected through any shared topics
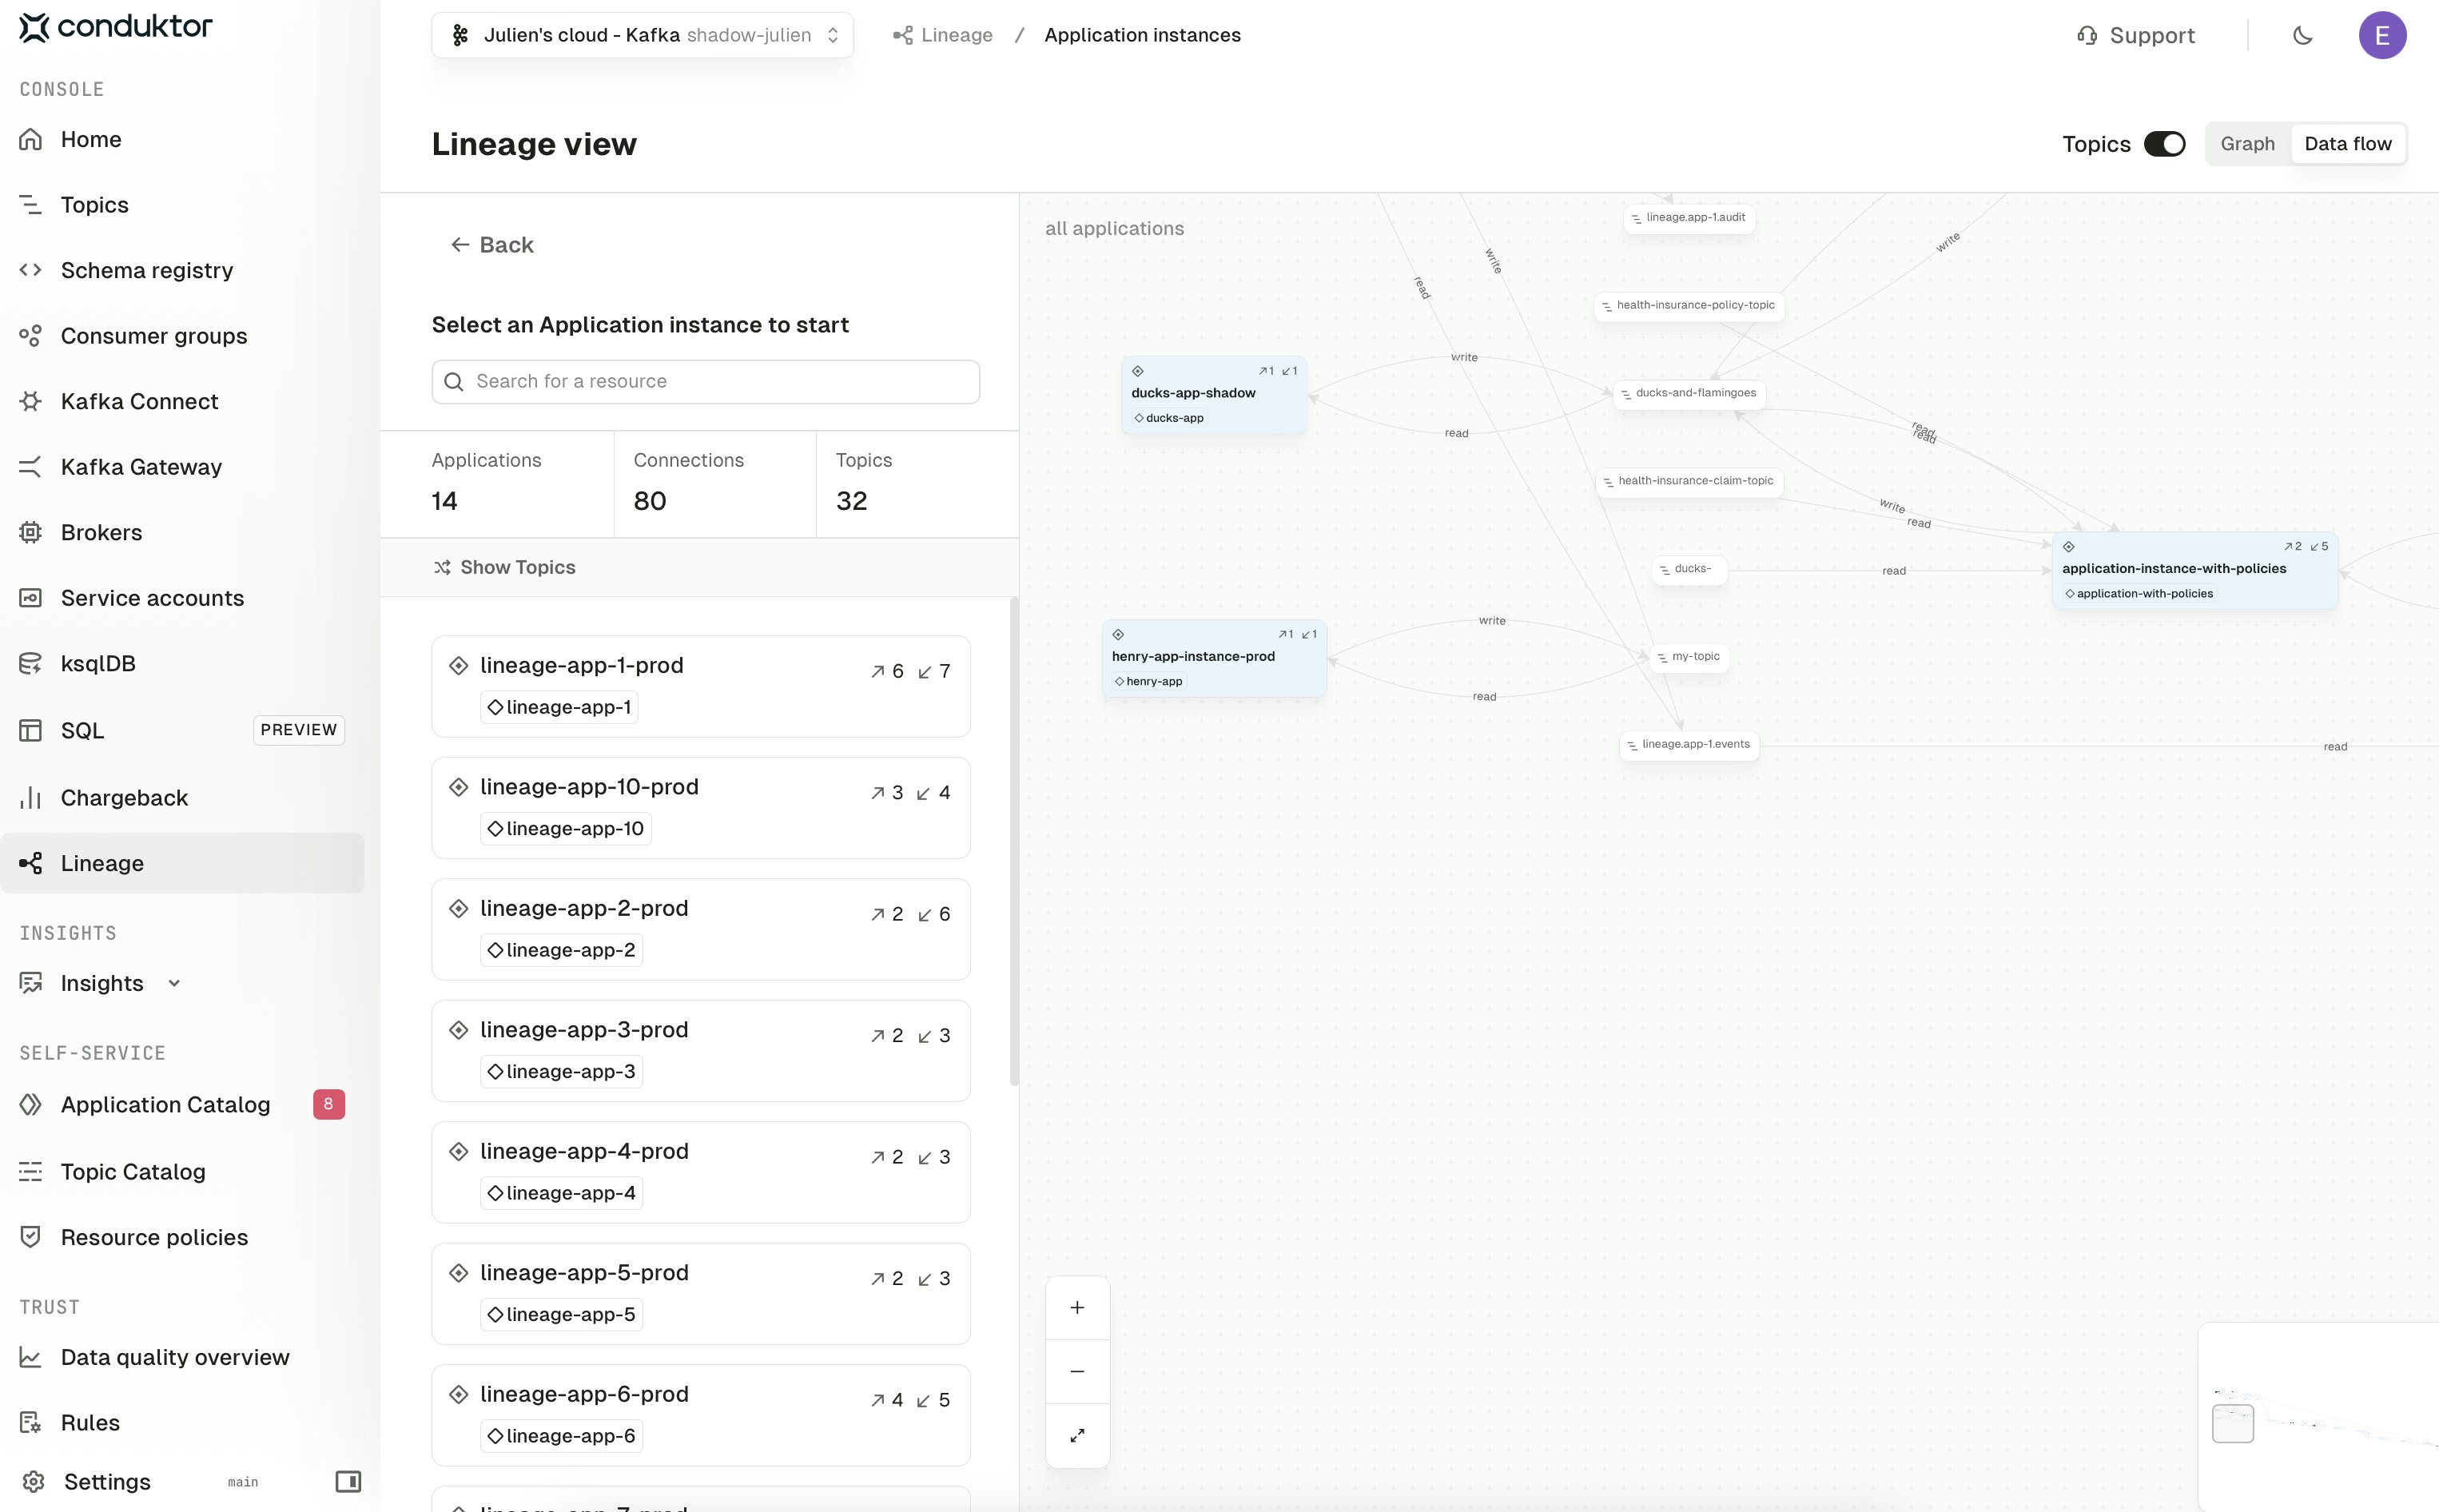
 Switch to **Data flow** in the top right to see a left-to-right view of the same relationships: the topics an instance reads from on the left, the instance in the middle, and the topics it writes to on the right, alongside the service accounts producing the data.
 ## Service account view
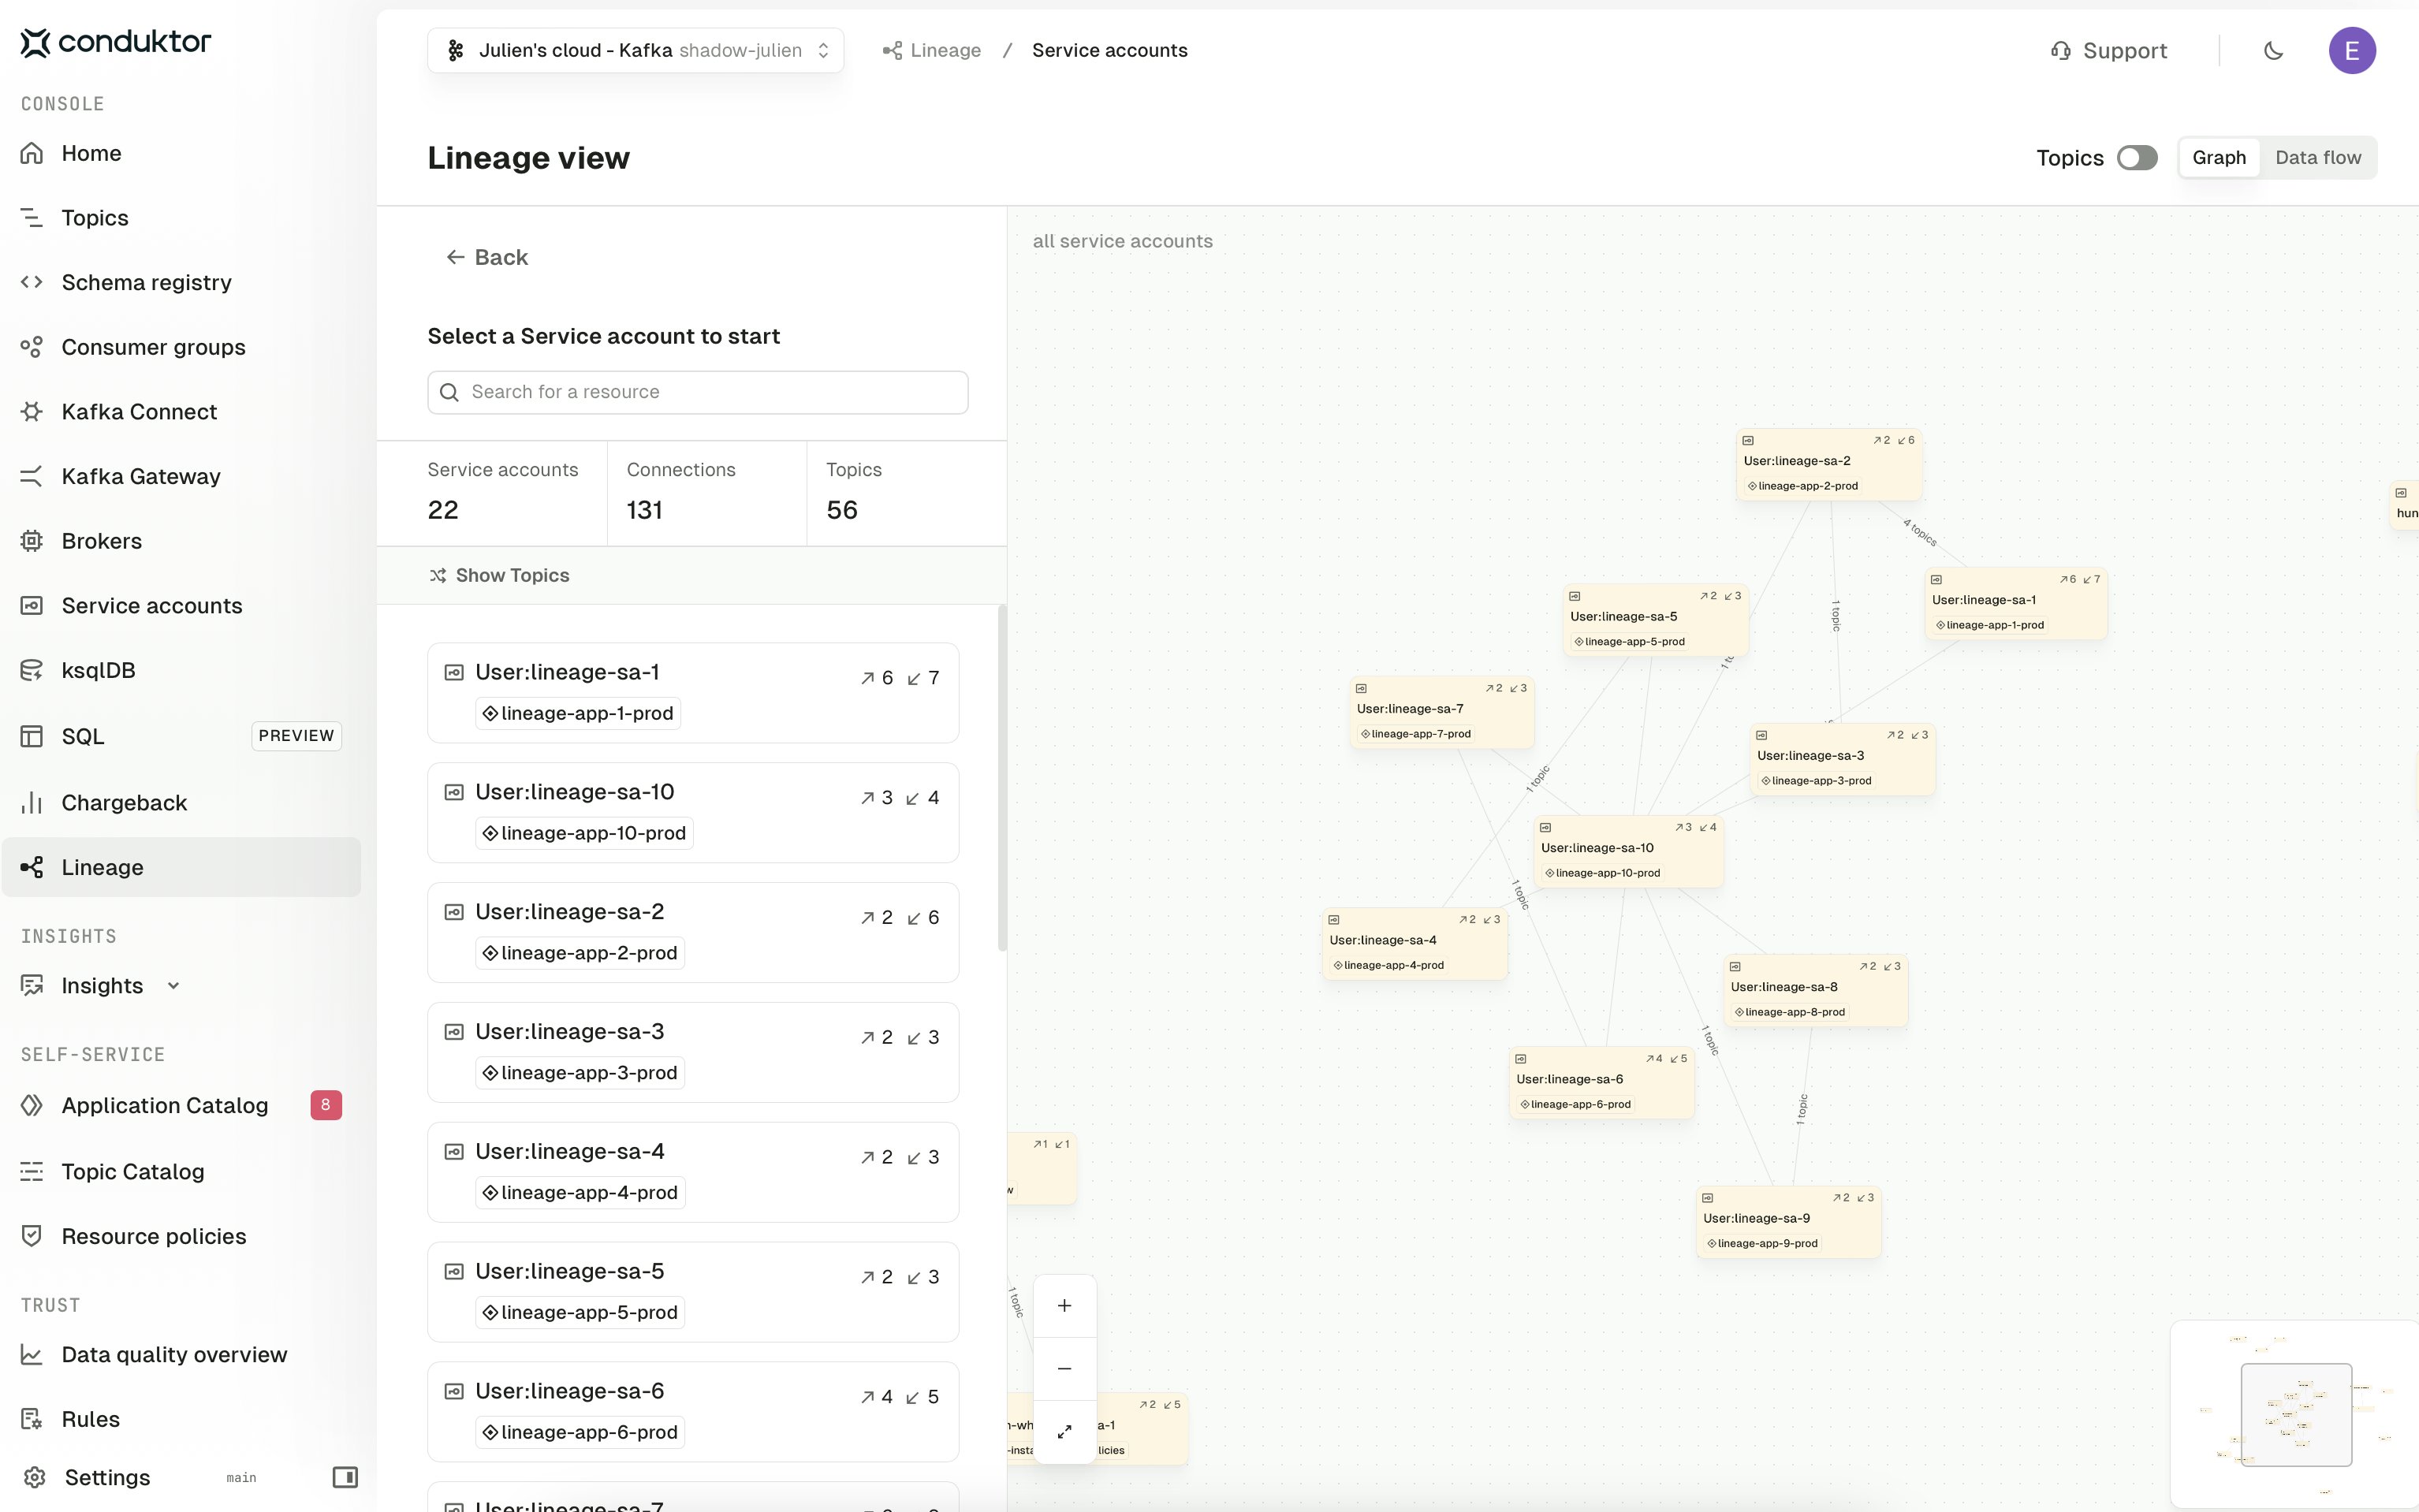
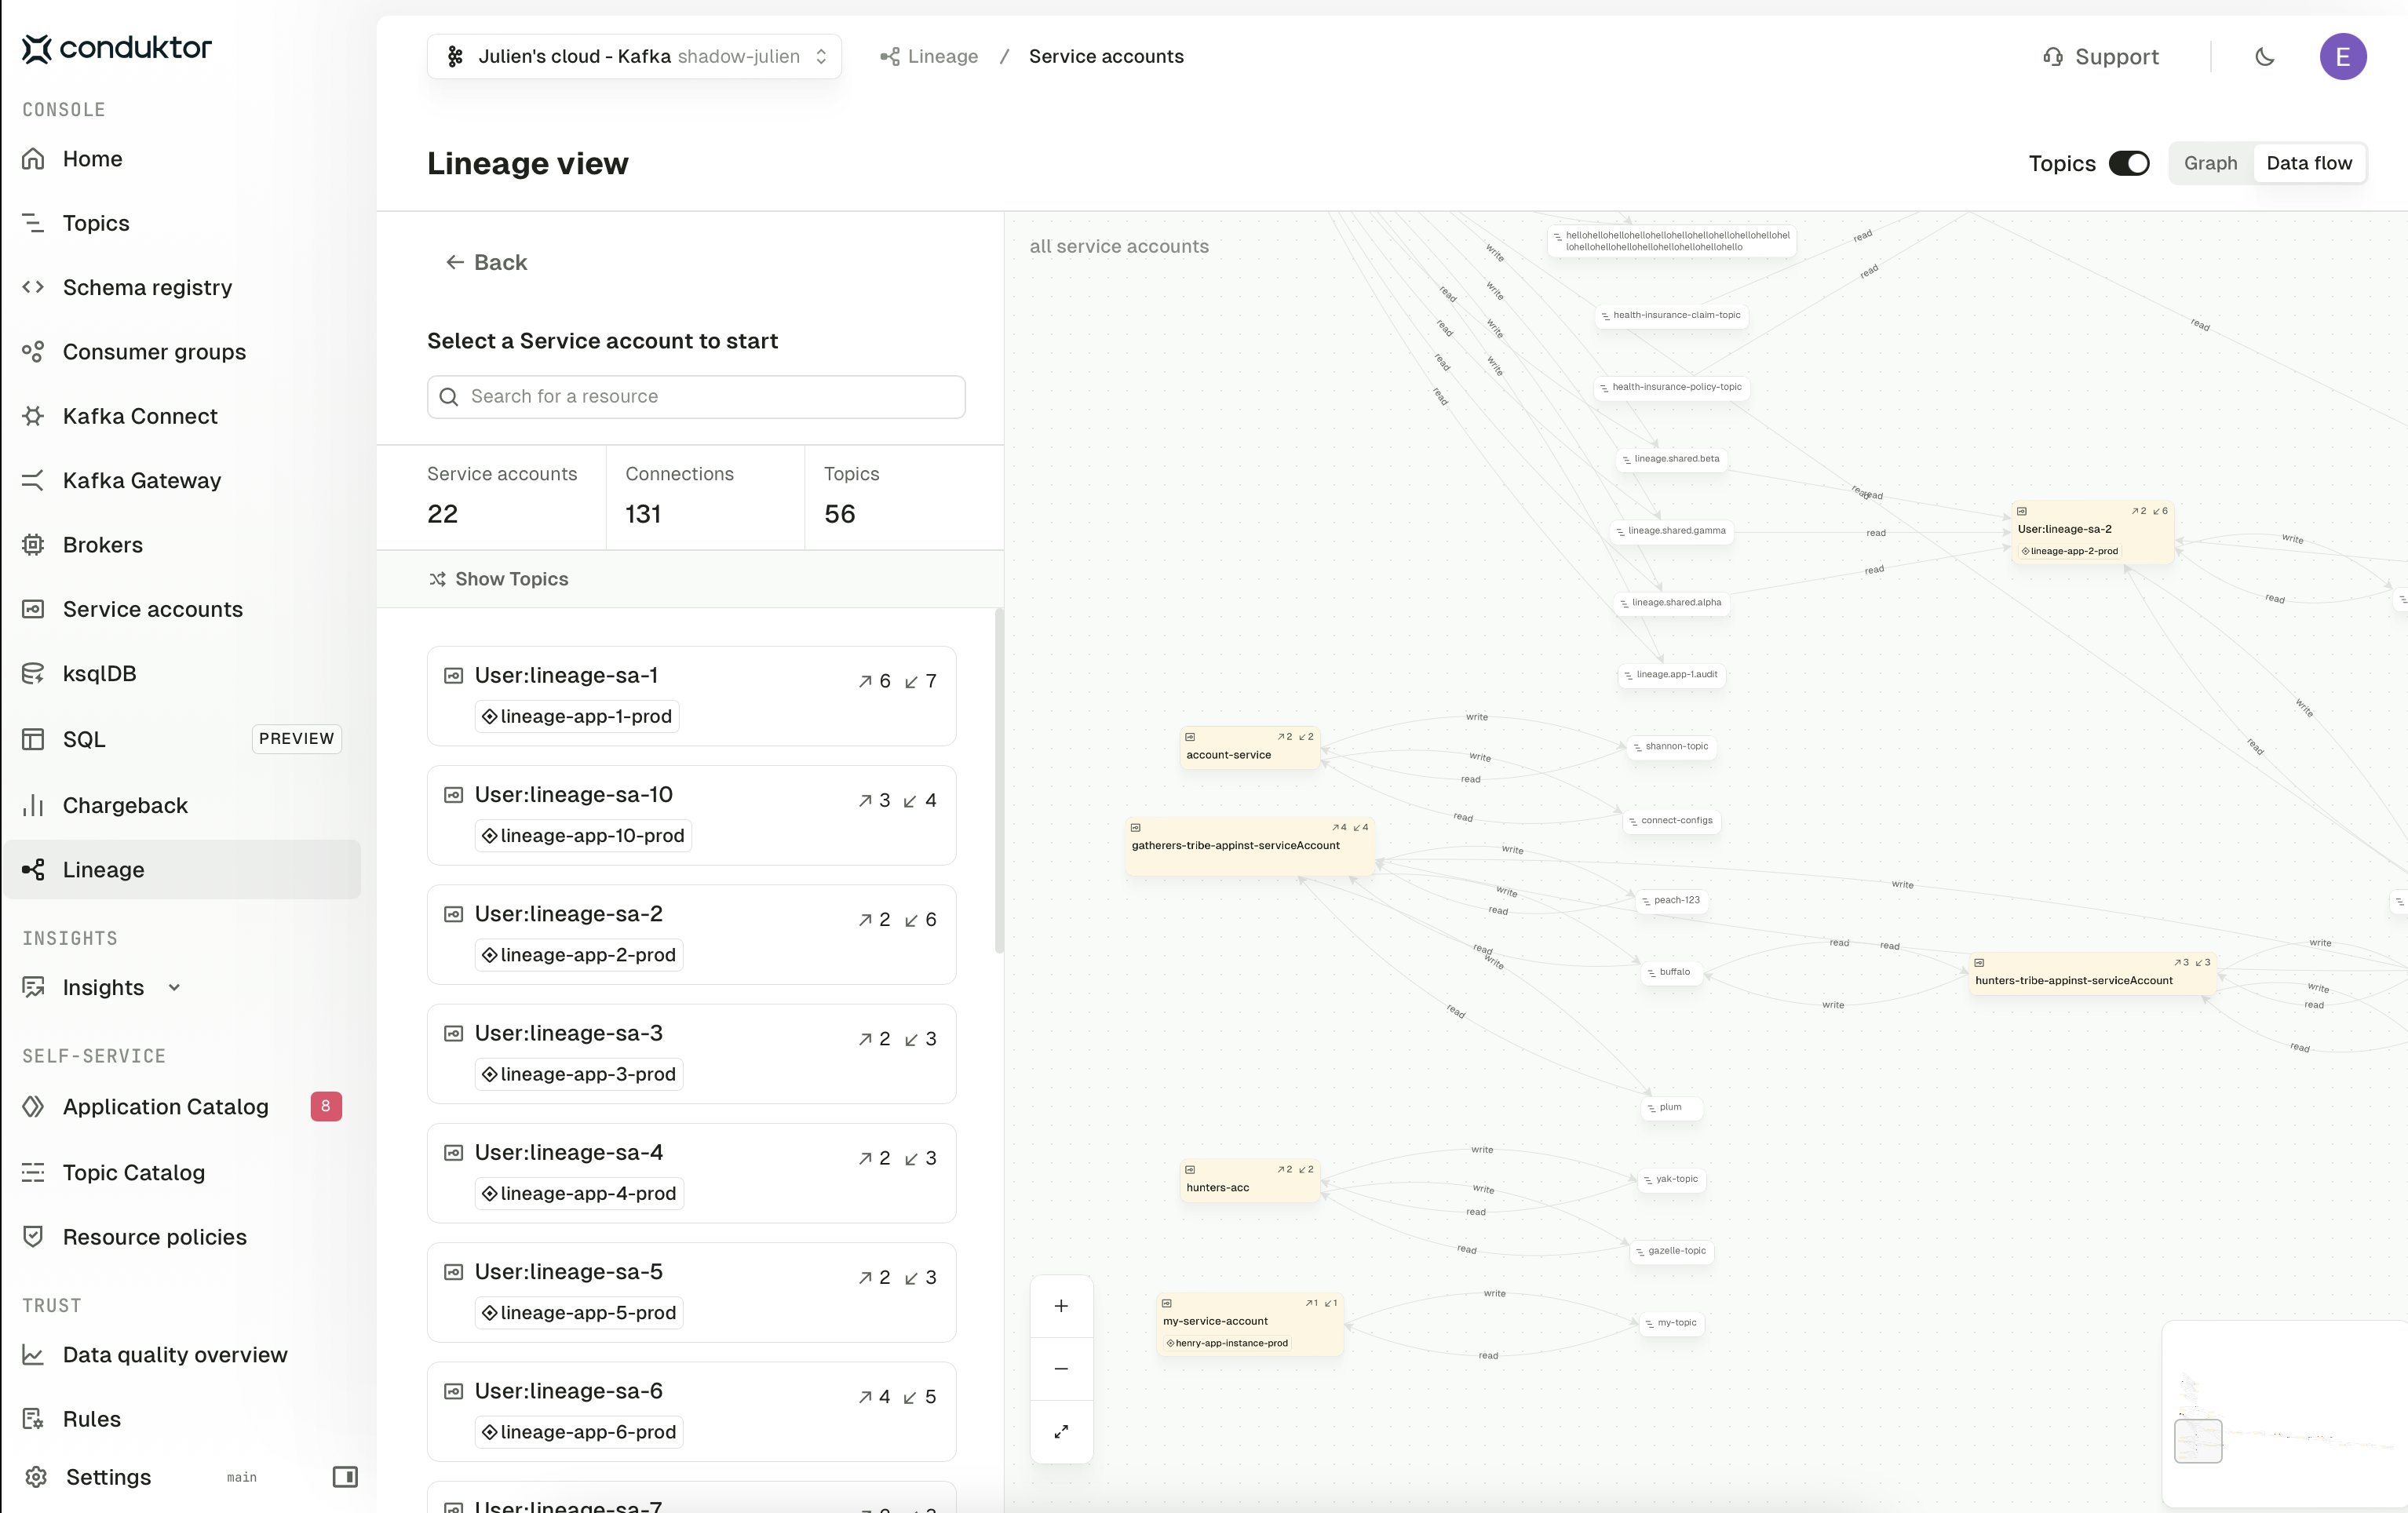
The Service account view shows the flow derived directly from Kafka authorization data, with each service account as a node and edges drawn from the ACLs (or role bindings) granting read or write access to a topic. This is the view to use when you want to reason about access at the authorization layer rather than the Self-service model — for example, to spot service accounts that have permissions outside of any registered application.
The **Topics** toggle and the **Graph** / **Data flow** switch behave the same as in the Application instance view.
## Service account view
The Service account view shows the flow derived directly from Kafka authorization data, with each service account as a node and edges drawn from the ACLs (or role bindings) granting read or write access to a topic. This is the view to use when you want to reason about access at the authorization layer rather than the Self-service model — for example, to spot service accounts that have permissions outside of any registered application.
The **Topics** toggle and the **Graph** / **Data flow** switch behave the same as in the Application instance view.
 The data flow view lays the same relationships out left to right, with the topics a service account reads from on the left and the topics it writes to on the right:
 ## Large graphs and drill-down views
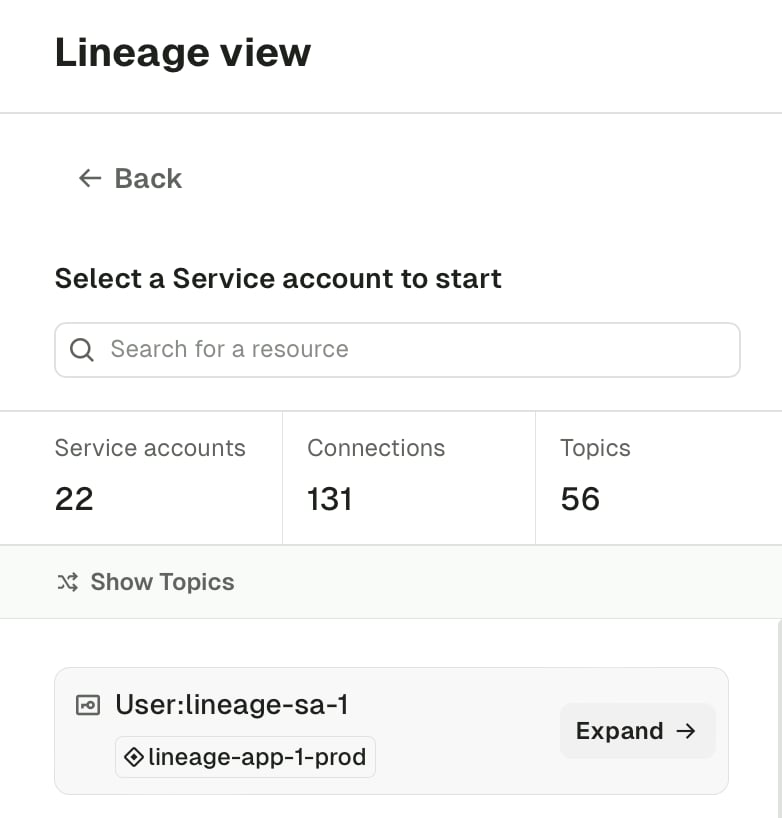
For clusters with more than 1,000 nodes in the graph, the UI truncates the rendered view to stay responsive. On these clusters, use the drill-down views instead: select an individual Application instance or service account from the sidebar list and click **Expand** to open a sub-graph that centers on that resource and shows only its transitive relationships to other services and topics.
## Large graphs and drill-down views
For clusters with more than 1,000 nodes in the graph, the UI truncates the rendered view to stay responsive. On these clusters, use the drill-down views instead: select an individual Application instance or service account from the sidebar list and click **Expand** to open a sub-graph that centers on that resource and shows only its transitive relationships to other services and topics.
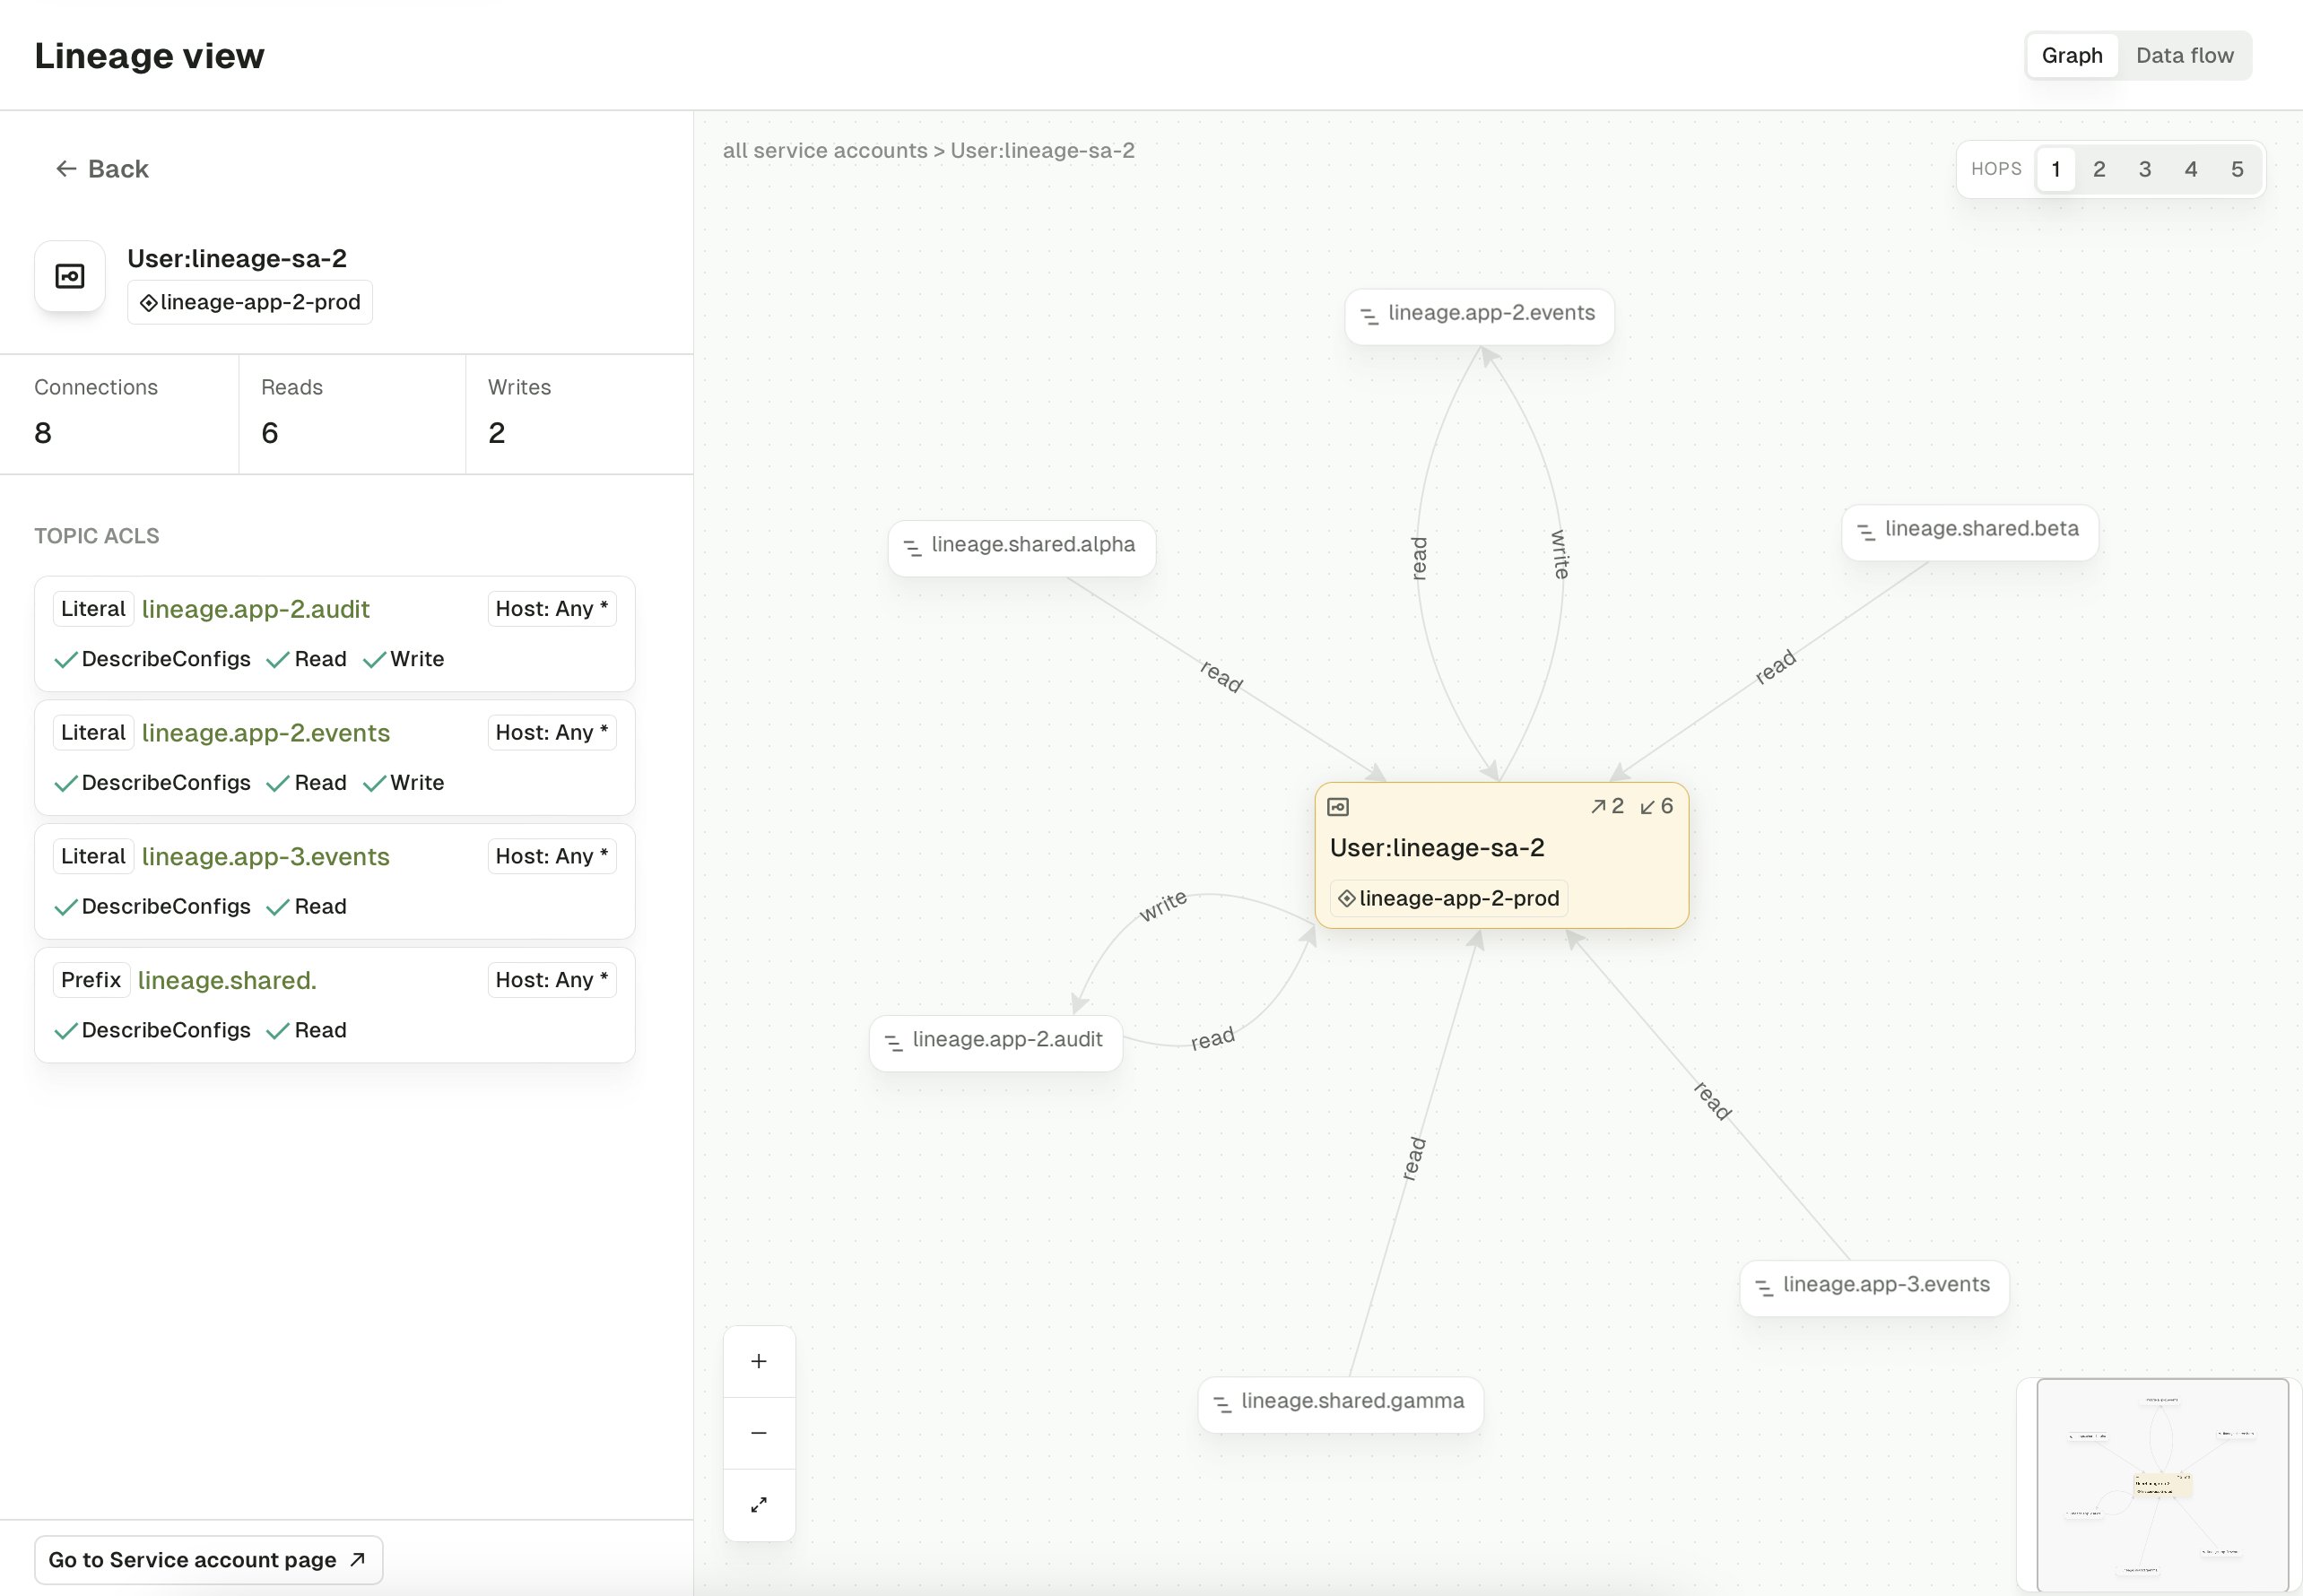
 The drill-down view focuses on the selected node, with read and write counts, the ACLs that produce each edge, and a **HOPS** control in the top right to widen or narrow how many relationship steps out from the node are included in the graph.
 ## Performance impact
Console caches each cluster's lineage graph in memory to keep the views responsive, which carries a small JVM heap cost. From our internal benchmarks, a cluster with a graph of around 15,000 nodes adds roughly 150 MB to the Console JVM heap while that cluster sits in the cache.
To keep the overhead bounded:
* Graphs are cached with a 15 minute TTL, after which Console rebuilds them on the next request
* At most three clusters' graphs live in the cache at any one time; cycling to a fourth cluster evicts the least recently used graph
To disable Stream lineage entirely or change the refresh frequency, set the relevant `CDK_STREAM_LINEAGE_*` options listed in the [Console environment variables reference](/guide/conduktor-in-production/deploy-artifacts/deploy-console/environment-variables#stream-lineage-properties).
## Related resources
* [Service accounts and ACLs](/guide/manage-kafka/kafka-resources/service-accounts-acls)
* [Self-service](/guide/use-cases/self-service)
## Performance impact
Console caches each cluster's lineage graph in memory to keep the views responsive, which carries a small JVM heap cost. From our internal benchmarks, a cluster with a graph of around 15,000 nodes adds roughly 150 MB to the Console JVM heap while that cluster sits in the cache.
To keep the overhead bounded:
* Graphs are cached with a 15 minute TTL, after which Console rebuilds them on the next request
* At most three clusters' graphs live in the cache at any one time; cycling to a fourth cluster evicts the least recently used graph
To disable Stream lineage entirely or change the refresh frequency, set the relevant `CDK_STREAM_LINEAGE_*` options listed in the [Console environment variables reference](/guide/conduktor-in-production/deploy-artifacts/deploy-console/environment-variables#stream-lineage-properties).
## Related resources
* [Service accounts and ACLs](/guide/manage-kafka/kafka-resources/service-accounts-acls)
* [Self-service](/guide/use-cases/self-service)