> ## Documentation Index
> Fetch the complete documentation index at: https://docs.conduktor.io/llms.txt
> Use this file to discover all available pages before exploring further.
# External monitoring setup
> Connect Conduktor Console to an existing Cortex, Mimir, or Prometheus stack. Available since Console v1.38 as alternative to deploying the Cortex.
Console v1.38 introduced support for external monitoring solutions including **Cortex**, **Mimir**, and **Prometheus**.
When using external monitoring solutions, Console connects to your existing monitoring infrastructure instead of deploying the `console-cortex` component.
[Check out monitoring-related resource reference](/guide/conduktor-in-production/deploy-artifacts/deploy-console/environment-variables#console-properties-reference).
## Configure
### Metrics collection
Your external monitoring solution has to be configured to scrape Console metrics from the `/api/monitoring/metrics` endpoint.
Example Prometheus scrape configuration:
```yaml theme={null}
scrape_configs:
- job_name: 'conduktor-console'
scheme: http
metrics_path: '/api/monitoring/metrics'
static_configs:
- targets: ['conduktor-console:8080']
```
### Basic auth for metrics scraping
Since Console v1.42.0, you can configure basic auth credentials to protect access to Console metrics. When configured, your monitoring backend must provide these credentials in order to scrape metrics from the `/api/monitoring/metrics` and `/monitoring/metrics/` endpoints.
Basic auth is optional in Console v1.42.0 and no configuration changes are required for existing deployments.
Configure basic auth on Console:
```yaml theme={null}
environment:
CDK_MONITORING_BASICAUTH_EMAIL: "metrics@example.com"
CDK_MONITORING_BASICAUTH_PASSWORD: "Hello123!"
```
The password must contain at least 8 characters, including one uppercase letter, one lowercase letter, one number and one special symbol.
Then configure your Prometheus scrape config to include these credentials:
```yaml theme={null}
scrape_configs:
- job_name: 'conduktor-console'
scheme: http
metrics_path: '/api/monitoring/metrics'
static_configs:
- targets: ['conduktor-console:8080']
basic_auth:
username: 'metrics@example.com'
password: 'Hello123!'
```
### Multi-tenancy support
If your Cortex or Mimir instance has multi-tenancy enabled, you can configure the tenant ID using:
```yaml theme={null}
environment:
CDK_MONITORING_TENANT-ID: "your-tenant-id"
```
This sets the `X-Scope-OrgId` header for authentication.
### Alerting system
If you configure a Cortex or Mimir integration, you can also set up Alertmanager for Console alerts. Alternatively, Console will use its own built-in alerting system.
Because Prometheus doesn't support configuration of alert rules via API, Console will always use its own built-in alerting system.
When configuring Alertmanager, Console will *override* the Alertmanager configuration. If you share the same Alertmanager instance with other applications, you have to ensure that multi-tenancy is enabled and that Console has a dedicated tenant.
## Configuration examples
### Cortex
```yaml theme={null}
services:
conduktor-console:
image: conduktor/conduktor-console
ports:
- "8080:8080"
environment:
# Connect to external Cortex instance
CDK_MONITORING_BACKEND: "cortex"
CDK_MONITORING_CORTEX-URL: https://cortex.your-domain.com:9009/
CDK_MONITORING_TENANT-ID: "conduktor" # Optional: Set tenant ID for multi-tenancy
CDK_MONITORING_ALERT-MANAGER-URL: https://alertmanager.your-domain.com:9093/
CDK_MONITORING_CALLBACK-URL: http://conduktor-console:8080/monitoring/api/
CDK_MONITORING_NOTIFICATIONS-CALLBACK-URL: http://conduktor-console:8080
# Other Console configuration...
```
### Mimir
```yaml theme={null}
services:
conduktor-console:
image: conduktor/conduktor-console
ports:
- "8080:8080"
environment:
# Connect to external Mimir instance
CDK_MONITORING_BACKEND: "mimir"
CDK_MONITORING_MIMIR-URL: https://mimir.your-domain.com:9009/
CDK_MONITORING_TENANT-ID: "conduktor" # Optional: Set tenant ID for multi-tenancy
CDK_MONITORING_ALERT-MANAGER-URL: https://alertmanager.your-domain.com:9093/
CDK_MONITORING_CALLBACK-URL: http://conduktor-console:8080/monitoring/api/
CDK_MONITORING_NOTIFICATIONS-CALLBACK-URL: http://conduktor-console:8080
# Other Console configuration...
```
### Prometheus
```yaml theme={null}
services:
conduktor-console:
image: conduktor/conduktor-console
ports:
- "8080:8080"
environment:
# Connect to external Prometheus instance
CDK_MONITORING_BACKEND: "prometheus"
CDK_MONITORING_PROMETHEUS-URL: https://prometheus.your-domain.com:9090/
CDK_MONITORING_NOTIFICATIONS-CALLBACK-URL: http://conduktor-console:8080
# Other Console configuration...
```
## Troubleshooting
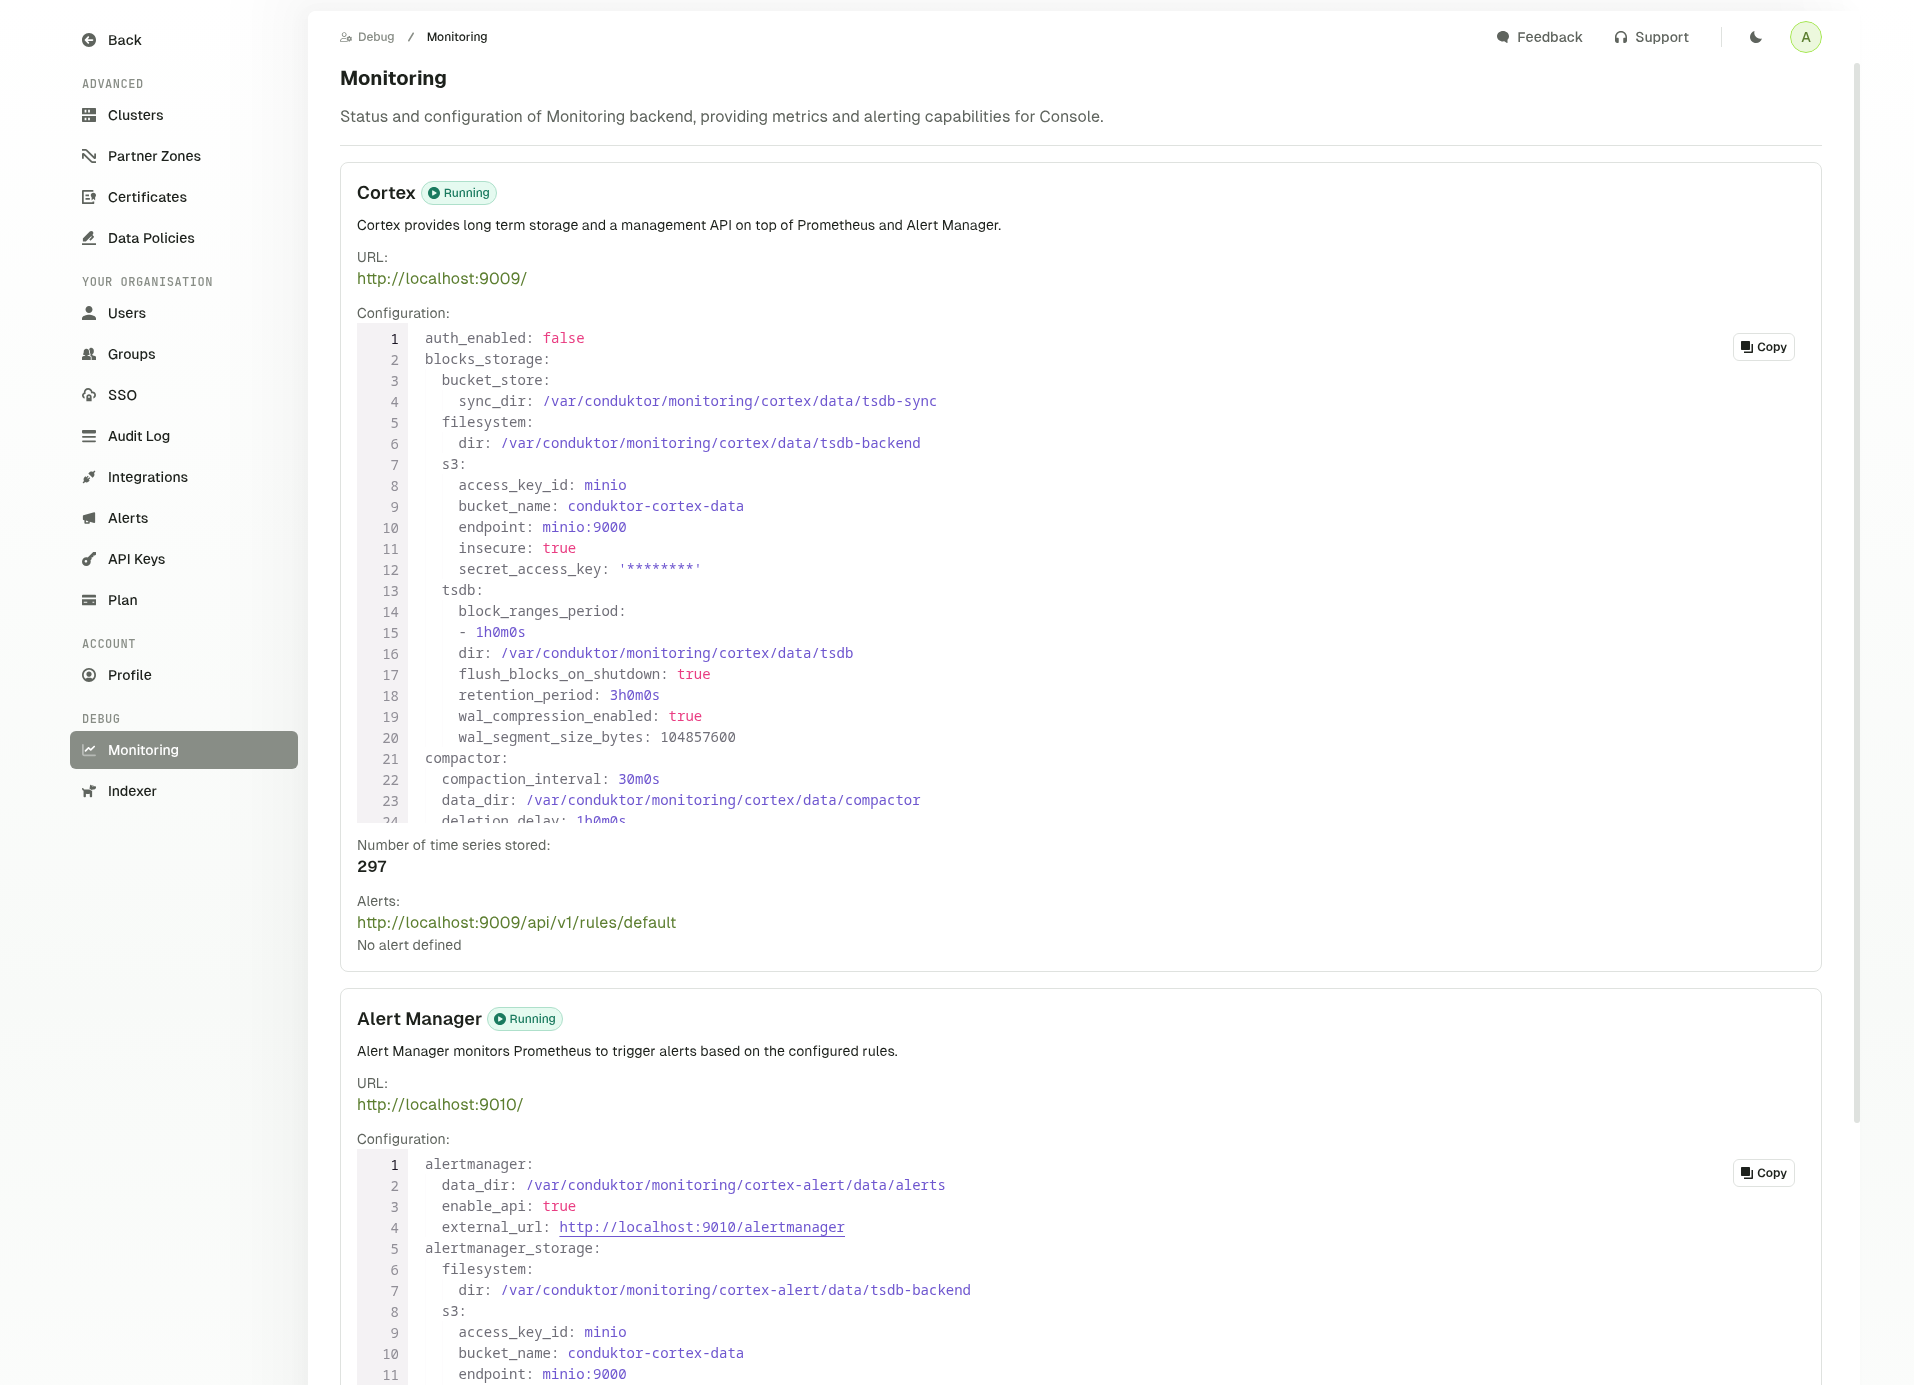
### Monitoring debug page
Console provides a dedicated troubleshooting page for administrators to diagnose monitoring connectivity issues. Access this page at: `/settings/debug/monitoring`
This debug page shows:
* Connectivity status to your monitoring solution
* Current configuration settings
* Metrics collection statistics