> ## Documentation Index
> Fetch the complete documentation index at: https://docs.conduktor.io/llms.txt
> Use this file to discover all available pages before exploring further.
# Kafka monitoring and observability
> Monitor Kafka broker health, consumer lag, partition status, and throughput with Conduktor Console.
Conduktor offers real-time statistics that provide insights into the most important Kafka metrics.
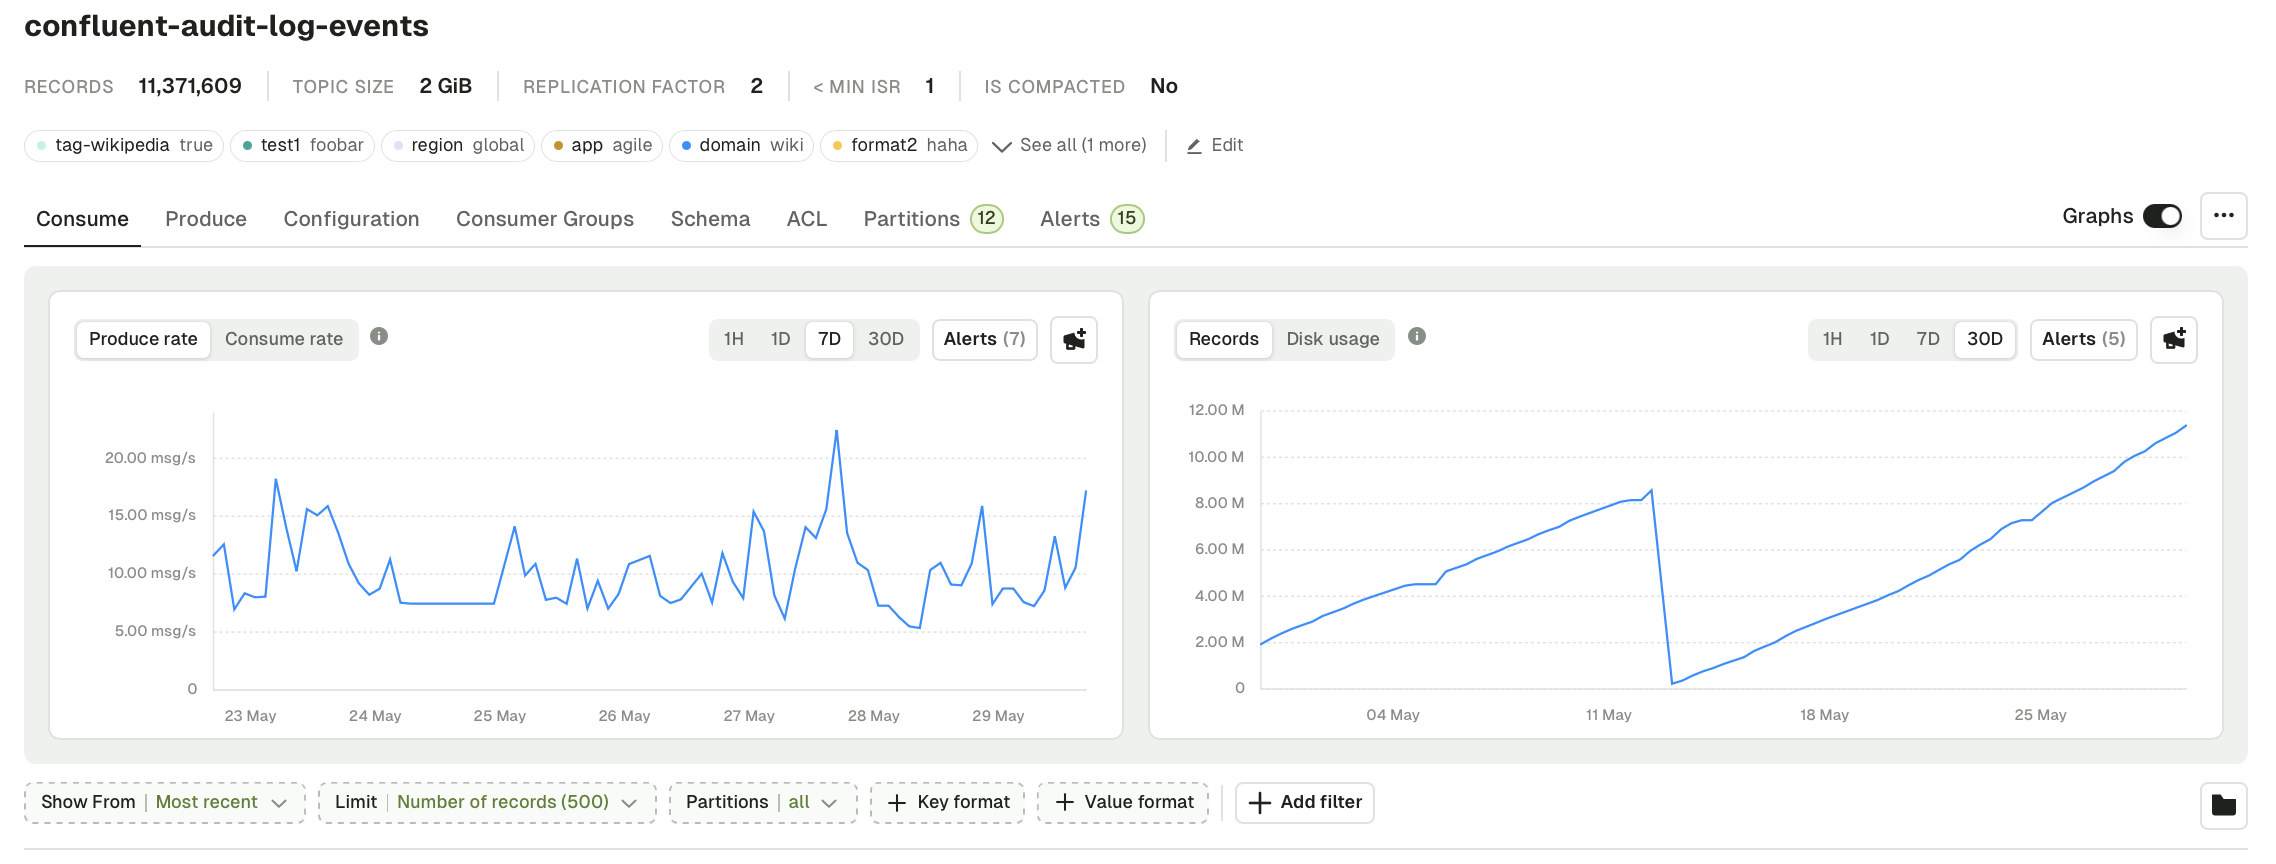 You can then [set up alerts](/guide/monitor-brokers-apps/alerts) to get notified about the [metrics](#monitoring-metrics) that matter to you.
Use the [Insights dashboard](/guide/insights) to identify infrastructure risks related to replication factors, partition distribution, and data skew across your topics.
## Prerequisite
[Deploy and configure Cortex](/guide/conduktor-in-production/deploy-artifacts/deploy-cortex) to enable monitoring and seamlessly integrate it with your existing systems.
## Ops monitoring
Operations monitoring enhances understanding of your Kafka infrastructure health, allowing you to monitor:
* cluster health state,
* partitions health state,
* topic activity, storage,
* and more.
## Application monitoring
Application monitoring enhances your understanding of your Kafka applications, by monitoring:
* consumer group states and
* consumer group lag
## Monitoring metrics
| Context | Metric | Description |
| ---------------- | ----------------------------------- | ------------------------------------------------------------------------------------------------------------------------------------------------------------------------------------------------------------------------------------------------------------------------------------------------------------------------------ |
| Apps monitoring | Consumer group status | Indicates healthy or critical status based on lag.
You can then [set up alerts](/guide/monitor-brokers-apps/alerts) to get notified about the [metrics](#monitoring-metrics) that matter to you.
Use the [Insights dashboard](/guide/insights) to identify infrastructure risks related to replication factors, partition distribution, and data skew across your topics.
## Prerequisite
[Deploy and configure Cortex](/guide/conduktor-in-production/deploy-artifacts/deploy-cortex) to enable monitoring and seamlessly integrate it with your existing systems.
## Ops monitoring
Operations monitoring enhances understanding of your Kafka infrastructure health, allowing you to monitor:
* cluster health state,
* partitions health state,
* topic activity, storage,
* and more.
## Application monitoring
Application monitoring enhances your understanding of your Kafka applications, by monitoring:
* consumer group states and
* consumer group lag
## Monitoring metrics
| Context | Metric | Description |
| ---------------- | ----------------------------------- | ------------------------------------------------------------------------------------------------------------------------------------------------------------------------------------------------------------------------------------------------------------------------------------------------------------------------------ |
| Apps monitoring | Consumer group status | Indicates healthy or critical status based on lag.
Critical if max lag/s exceeds 180. |
| Apps monitoring | Lag message count | Number of messages each consumer group is behind per partition. |
| Apps monitoring | Lag(s) | Estimated number of seconds that each consumer group is behind in the topic. |
| Cluster health | Messages count
per broker (s) | This metric gives you the ability to gauge how active your producers are. Given batching and other factors this metric will change over time. |
| Cluster health | Messages in
per broker (B/s) | This metric provides the amount of bandwidth per broker that's been taken up by producers as well as replication from partitions the broker leads in your cluster. This is useful for planning well distributed leader placement. |
| Cluster health | Messages out
per broker (B/s) | This metric indicates how much bandwidth per broker is being utilized by consumers, as well as for replication to the broker. This is useful for planning replica and leader placements. |
| Cluster health | Offline partitions count | Offline partitions can be caused by lingering capacity issues, crashed brokers or cluster-wide faults. This is a critical factor in the health of your cluster - an offline partition can't be produced to or consumed from. If the controller believes a partition is offline, it may not re-assign or bring online a leader. |
| Cluster health | Under-replicated partitions count | Partitions that are under-replicated are a risk to data durability and availability. Under-replicated partitions can happen for various reasons, including an inability for replicas to keep up or network splits. |
| Cluster health | Under min ISR partitions count | Under minimum ISR partitions don't meet the durability requirements to be produced to. If producers that try to produce messages to a partition that's under the specified minimum, ISR will reject the messages and will be forced to handle the exception. |
| Cluster health | Disk - FS usage | If a Kafka broker fills up, its disk durability and availability means that data is at risk. Producers will also be unable to produce to that broker. Filling a broker's disk is also a hard incident to recover from and often involves loss of data. |
| Cluster health | Partitions count | Total number of partitions (including replicas) across the selected Kafka cluster. |
| Cluster health | Active brokers count | Number of active brokers on the selected Kafka cluster. |
| Cluster health | Active partitions count | Total number of partitions active on the selected Kafka cluster. |
| Cluster health | Active controllers count | Total number of active controllers on the selected Kafka cluster. |
| Topic monitoring | Messages count per topic (/s) | Number of messages produced per second, per broker at a topic granularity. |
| Topic monitoring | Topic traffic in (B/s) | Byte rate per second of messages produced, per broker at a topic granularity. |
| Topic monitoring | Topic traffic out (B/s) | Byte rate per second of messages consumed, per broker at a topic granularity. |
| Topic monitoring | Total size of messages | Total size of messages in the topic. |
## Troubleshoot
This happens because of automatic time interval increases for performance optimization:
* **30 day** views use eight hour step intervals
* **7 day** views use two hour step intervals
* Shorter views use smaller step intervals
When brief (lasting a few minutes) spikes occur within these larger time intervals, they are averaged and become invisible in the graph visualization. For example, a five minute data spike will be averaged across a two or eight hour window, making it appear as zero or negligible in the graph.
**Workaround**: use Grafana with a custom PromQL query to get higher resolution:
```promql theme={null}
sum(kafka_topic_produce_rate{cluster_id="gateway", topic="test"})[30d:1m]
```
This shows data over a **30 day** range with **one minute** step intervals, ensuring that brief spikes are not averaged.
Using high-resolution queries may impact performance. Assess the performance trade-offs in your own Grafana instance and adjust the range/step size accordingly.
## Related resources
* [Deploy Cortex](/guide/conduktor-in-production/deploy-artifacts/deploy-cortex)
* [See all available metrics](/guide/reference/console-metrics)
* [Set up alerts](/guide/monitor-brokers-apps/alerts)
* [Give us feedback/request a feature](https://conduktor.io/roadmap)