

Overview
This tutorial sets up Chargeback in Console, including the optional sources required for ingress and egress metrics:- Confluent Cloud throughput — calls the Confluent Cloud Metrics API hourly
- Gateway throughput — relies on the observability Interceptor deployed on Gateway
From our blog: Chargeback: attribute and map Kafka costs to your business Practical strategies to tag, trace, and report Kafka spending by team and application.
Prerequisites
Environment variables
Set these on Console before starting it.The same
CDK_CHARGEBACKV2_ENABLED flag is used by the Chargeback feature regardless of cluster type.Enable Chargeback in Console
From Console v1.46.0, Chargeback is enabled by default, and Chargeback appears in the left navigation. To turn it off, setCDK_CHARGEBACKV2_ENABLED to false:
- bash
- docker compose
- Setting the per-cluster unit costs (storage, partitions, ingress, egress and the default connector task hour cost, plus any per-connector-class overrides)
- Selecting which label keys are eligible as Chargeback Labels
Collect Gateway throughput
Ingress and egress for Gateway clusters are produced by the observability Interceptor running on Gateway. If you only need storage and partition metrics for Gateway clusters, you can skip this section.1
Connect Gateway to Console
In Console, go to Settings > Clusters and select your cluster. In the Provider tab, select Gateway and enter the Gateway API details with the Virtual Cluster value of 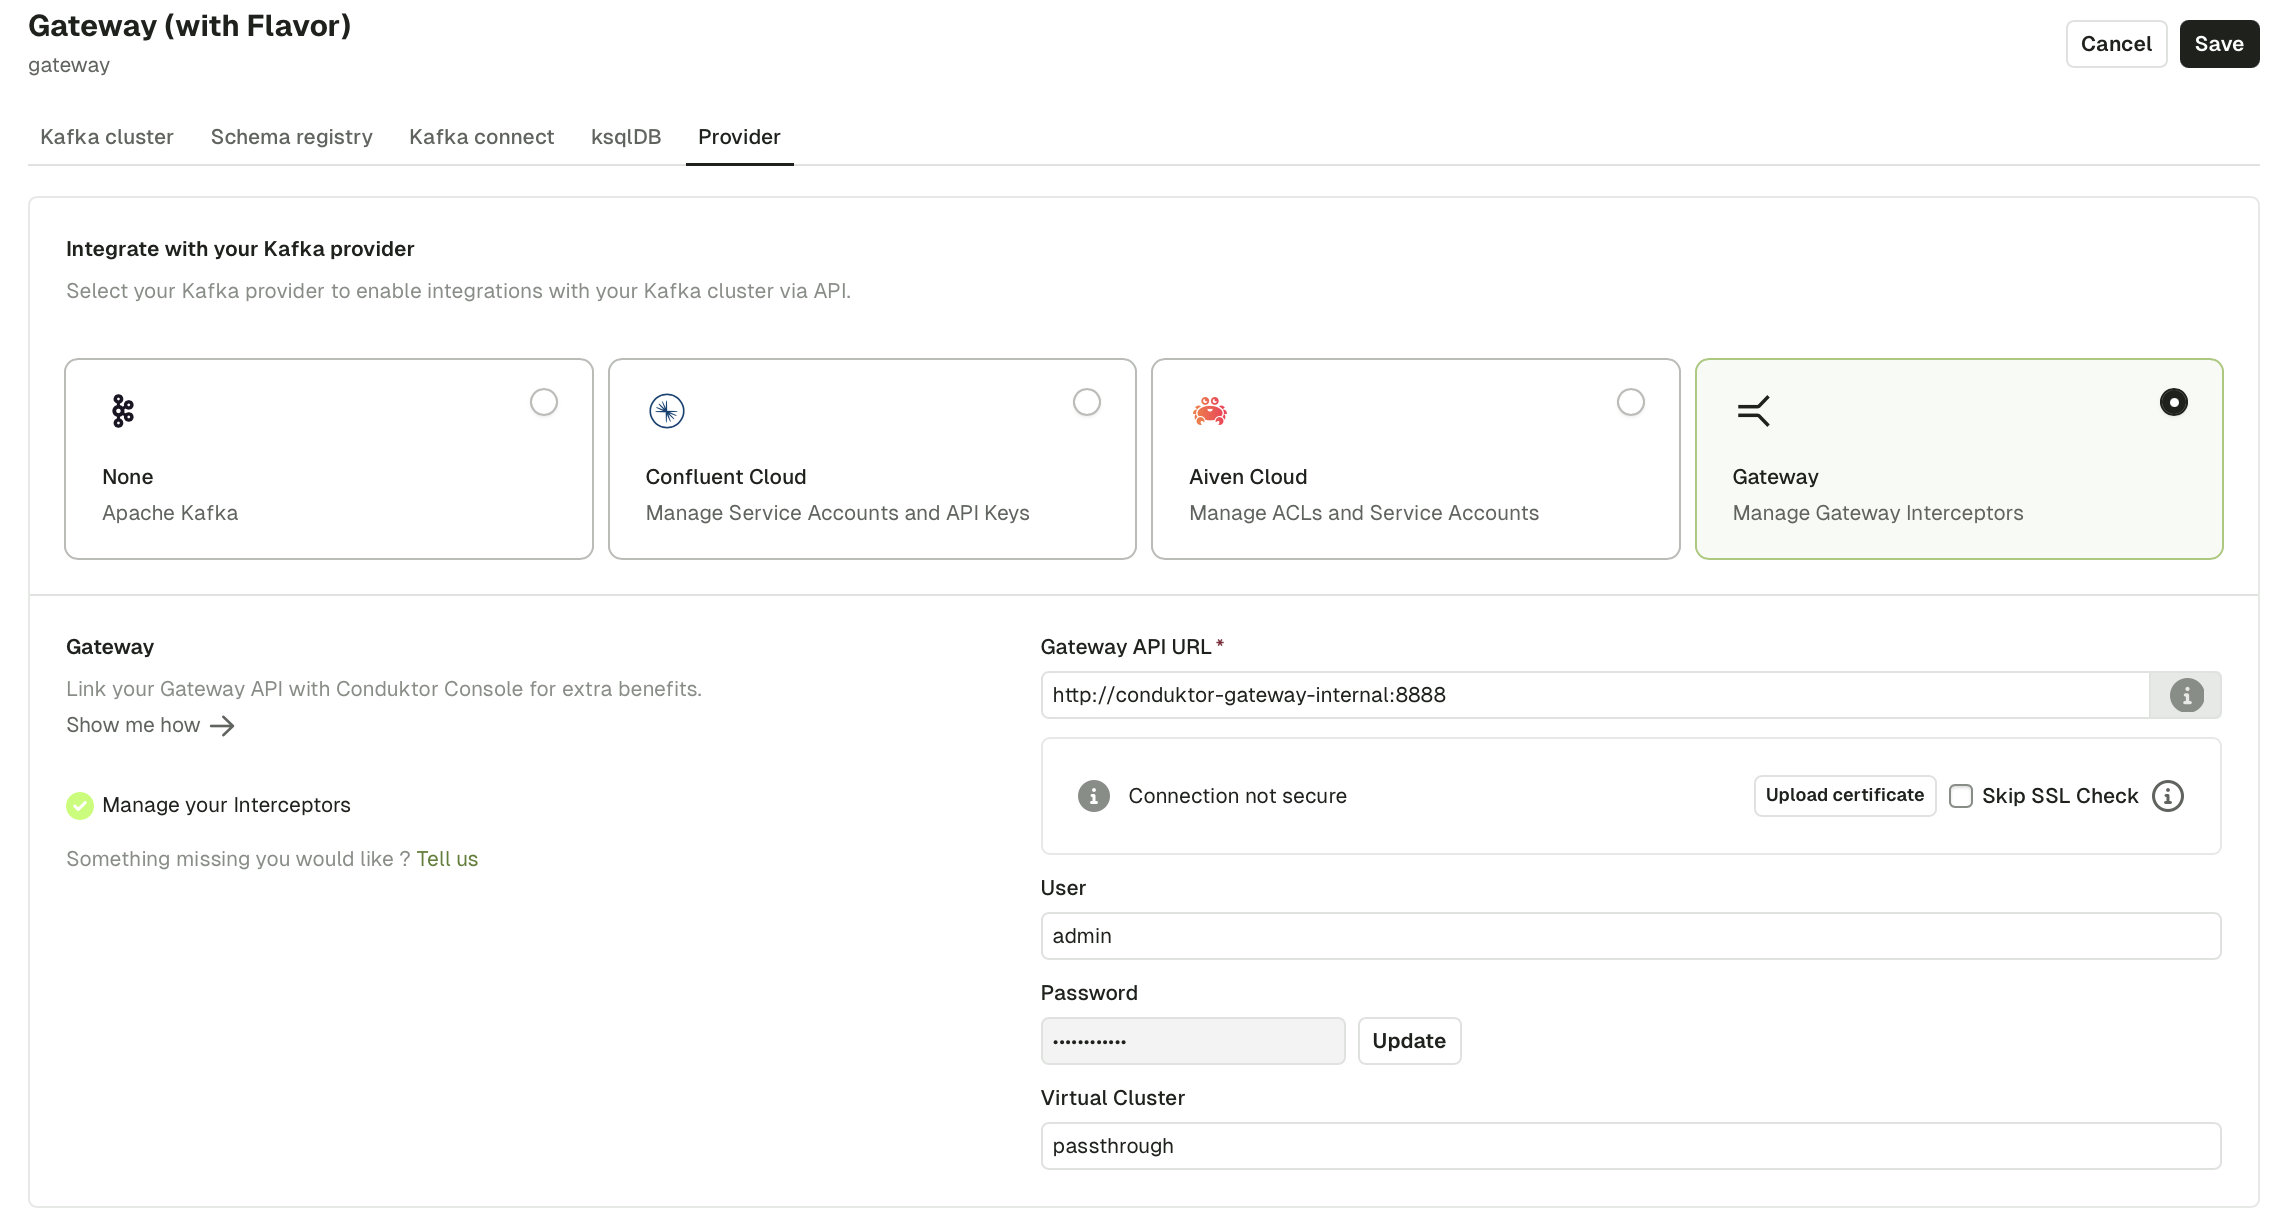
passthrough.2
Deploy the observability Interceptor on Gateway
- curl
- Conduktor CLI
Observability Interceptor reference
Collect Confluent Cloud throughput
Confluent Cloud ingress and egress are pulled hourly through the Confluent Cloud Metrics API. Collection is on by default. To enable collection on a cluster, configure the cluster in Console with API credentials that include Metrics API access. No further setup is needed. To turn collection off globally, set:Verify
1
Wait for the first collection tick
Storage and partition metrics appear after the first snapshot (default: one hour). Confluent Cloud throughput appears after the first hourly tick. Gateway throughput appears once the observability Interceptor has flushed to the metrics topic (default: every five minutes).
2
Open the Chargeback page
Cluster rows show non-zero values for the axes that match the cluster type.
3
Check cost configuration
Click the settings (cog) icon at the top right of the Chargeback page. Confirm that all clusters that should appear are listed with the expected unit costs.
Console begins collecting metrics immediately after the feature flag is set, but data only appears after the first collection interval.