How it works
You create that define the expected format and content of messages, then attach them to that target specific Kafka topics or topic prefixes. Conduktor evaluates these Rules against every message produced on targeted topics after Policy creation and tracks the count of violating messages as well as the total number of messages evaluated.Observe vs enforce
The capabilities depend on whether you’re using : Without Gateway (observe only)- Records are verified after they have been produced
- Track violations and monitor data quality issues
- No impact on message flow
- Records are verified before production
- See which service accounts produced the faulty records
- Take action on faulty records:
- Block: reject the message (and the entire record batch). The producer receives a non-retriable error. Find out about handling blocked batches
- Mark: add a header to the record containing all violated rules for every Policy using the mark action
- Prevent bad data from entering your topics
Key constraints
- Policies cannot mix different target cluster types (Gateway vs. non-Gateway)
- You can’t target a Gateway-backing cluster directly to avoid validation conflicts
From our blog: Kafka data contracts: a schema is not a contract Why a schema alone won’t stop a producer from breaking consumers, and where to enforce the contract.
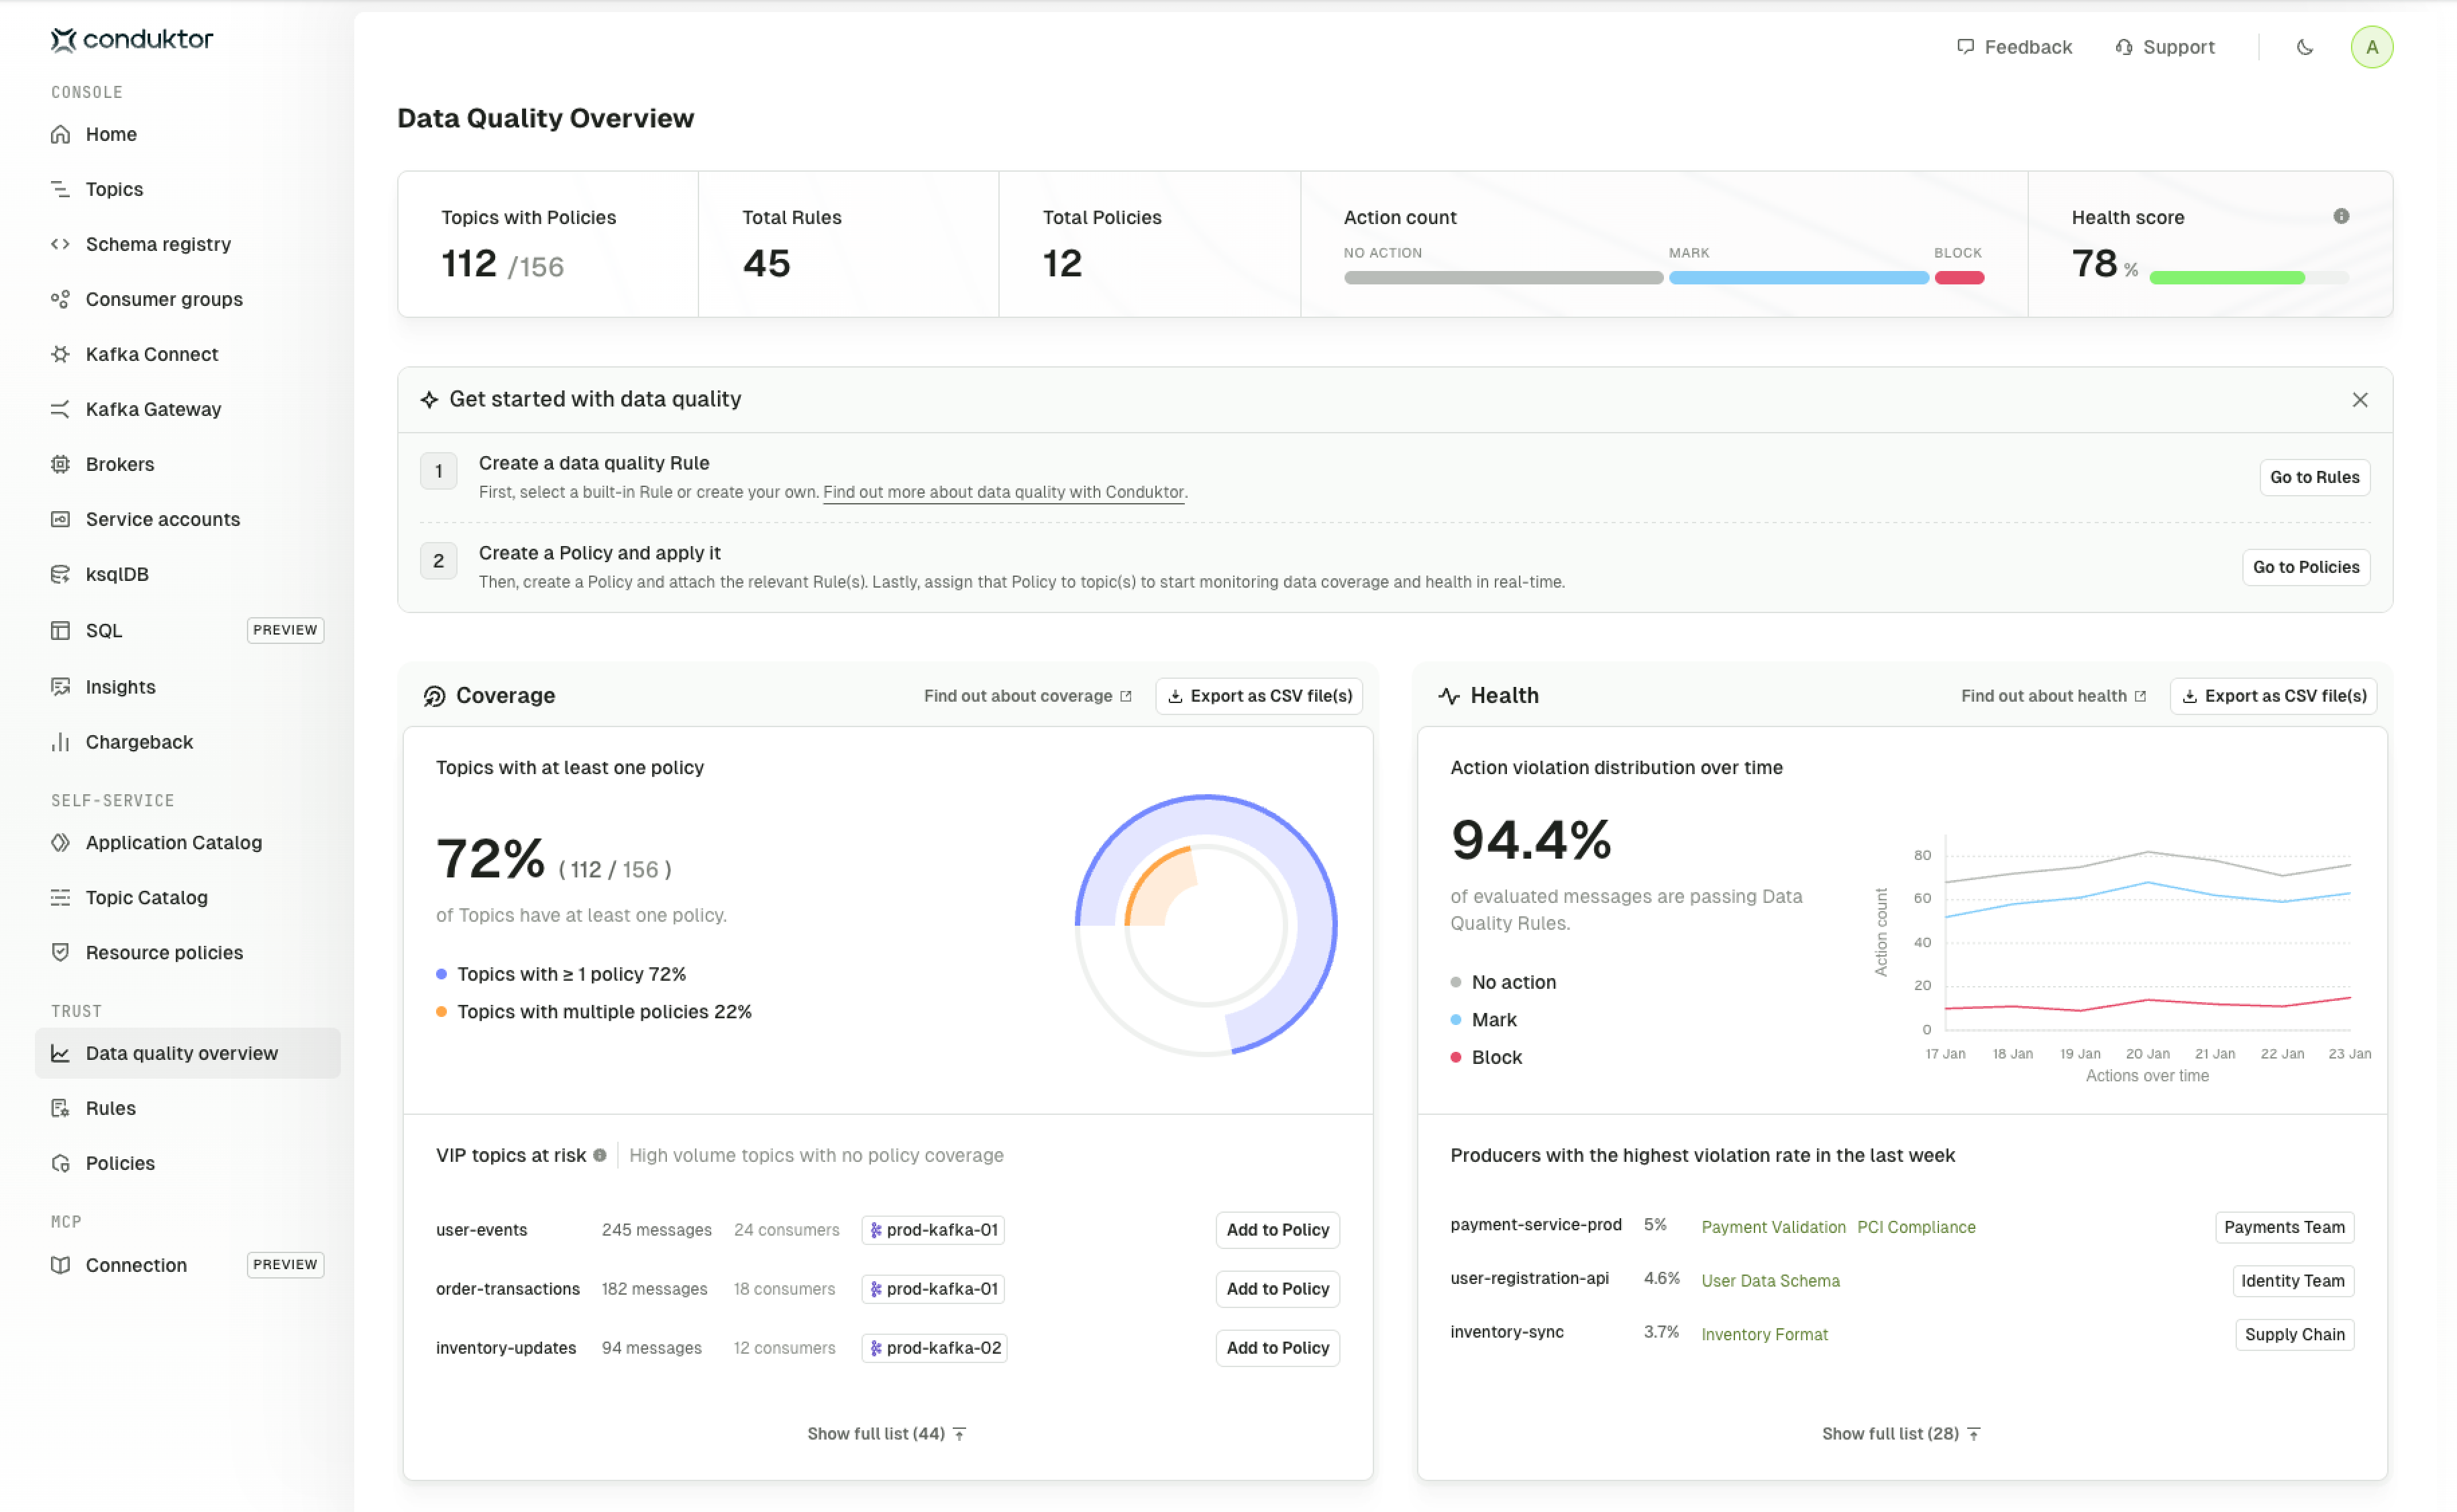
Data quality metrics
The quality overview dashboard provides a summary of your data quality governance across the entire ecosystem. Use it to:- Track progress: monitor how many topics are protected by Policies
- Identify gaps: find high-volume topics without coverage
- Measure health: see which producers need attention and how well your Policies are performing. The health score is calculated based on the number of topics that have Policies assigned, with a modifier that determines how effectively they’re enforced (for example, whether violations are blocked).
- Take action: click through to add topics to Policies or investigate violations
To see metrics, you need to have at least one topic with a Policy assigned to it.
Coverage
The coverage metrics show how many topics are protected by Policies.- Topics with at least one Policy: percentage of topics with Policy coverage
- Topics with multiple Policies: percentage of topics with layered validation
- VIP topics at risk: highly utilized topics with no Policy coverage that should be prioritized. VIP topics are those with activity within the last 24 hours, containing over 500 messages or topics that have more than 3 consumers.
Health
The health metrics show how effectively your Rules are being enforced.- Health score: overall data quality based on coverage and enforcement
- Action distribution: breakdown of no action, mark and block actions over time
- Top violating producers: producers with the highest violation rates to help prioritize remediation
Mark and block actions and producer identification require Gateway. Without Gateway, violations are reported but not enforced and you will not see information about the producer of violations on non-Gateway topics.