Overview
Bad data breaks customer experiences, drives churn and slows growth. Conduktor helps teams catch and fix data quality issues before they impact your business. You define the Rules and we’ll enforce them at the streaming layer. Find out more about data quality.This page details Conduktor’s capability to enforce data quality with .Find out about data quality capabilities without Gateway.
From our blog: Validate JSON in Kafka without migrating to Schema Registry Block malformed JSON before it breaks downstream consumers, no Schema Registry migration needed.
Prerequisites
Before creating data quality Rules and Policies, you have to:- use Conduktor 1.34 or later,
- use Conduktor Gateway 3.9 or later,
- be logged in as an admin to Console UI or use an admin token for the Conduktor ,
- configure your Gateway cluster in Console and fill in the Provider tab with Gateway API credentials.
Rules
You can define three different types of Rules that will validate your Kafka message data quality: do nothing on their own - you have to attach them to a .
Create a Rule
You can create a data quality Rule (CEL or JSON schema) using the Console UI or the Conduktor CLI.Test Rules before creation
When creating Rules using the Console UI, you can test both CEL expressions and JSON schema Rules against sample data before saving changes. This helps with ensuring that your Rules work correctly with the expected data format, allowing you to iterate quickly and ensure that the Rules will work as expected before deploying them to production topics.- Click Validate your Rule against sample messages to open the validation panel.
- In the Rule validation panel enter:
- Key: sample message key (only for CEL rules that reference
keyproperties) - Value: sample message value (the main data payload that your Rule will validate)
- Headers: sample message headers (only for CEL rules that check header values)
- Key: sample message key (only for CEL rules that reference
- Click Test Rule to validate it.
- A message will appear explaining whether the Rule has passed, failed or if there’s an evaluation error (an issue with your Rule syntax or data format).
- Console UI
- Conduktor CLI
To create a Rule using the Console UI:
- Go to Rules and click +New Rule.
- Define the Rule details:
- Add a descriptive name for the Rule.
- The Technical ID will be auto-populated as you type in the name. This is used to identify this Rule in CLI/API.
- (Optional) Enter a Description that explains the purpose of your Rule.
- Select the Rule type (CEL expression or JSON schema) and provide the required logic:
- CEL is an expression language supporting common operators like
==and>as well as macros likehas()to check for the presence of fields. Usematches()to test regex patterns. See the CEL language definition for details . You can access a set of pre-built examples by clicking Show regex library. Click on the relevant example to copy it and paste into your Rule expression. You can then customize it further, as necessary. - For JSON schema, enter your schema definition. See the JSON schema specification for details .
- CEL is an expression language supporting common operators like
- (Optional) Define a custom message that replaces the default
<RULE_NAME> did not passwhen the Rule is violated, shown in the Policy violation history. - Click Create.
CEL expression Rules
You can create Rules with CEL expressions that capture business logic of your data. For example:value.customerId.matches("[0-9]{8}").
The Rules page lists your Rules with a preview of their CEL expressions. Open a Rule’s detail page to see its description, full CEL expression and attached Policies.
Sample CEL Rules
Make sure you amend these examples to use your values.
Email RegEx validation
Email RegEx validation
Your requirements may be different from this RegEx, as email validation via RegEx is complex.
value.customer.email.matches(r"^[a-zA-Z0-9._%+-]+@[a-zA-Z0-9.-]+\.[a-zA-Z]{2,}$")UUID RegEx validation
UUID RegEx validation
value.customer.id.matches(r"^[0-9a-fA-F]{8}\b-[0-9a-fA-F]{4}\b-[0-9a-fA-F]{4}\b-[0-9a-fA-F]{4}\b-[0-9a-fA-F]{12}$")Ensure Header is JSON
Ensure Header is JSON
headers['Content-Type'] == 'application/json'Built-in Rules
We provide built-in validation Rules that can’t be achieved with CEL.We currently only support Confluent and Confluent like (e.g. Redpanda) schema registries.
EnforceAvro
EnforceAvro ensures that:
- Your messages have a schema ID prepended to the message content.
- The schema ID exists within your schema registry.
- The schema it references is of type
avro.
JSON schema Rule
Enforce JSON Schema validation on Kafka messages to ensure data consistency and structure compliance.Configure JSON schema
Add a JSON schema Rule using the CLI:Schema requirements
- Has to conform to the JSON schema specification
- If no
$schemais specified, will default to draft 2020-12
Examples
Basic User Validation
Basic User Validation
Schema with Version
Schema with Version
No Additional Fields Allowed
No Additional Fields Allowed
Policies
A Policy is made up of Rules that are applied to topics/prefixes. Once created, Policies can be assigned actions to take effect when certain criteria is met (e.g., a Rule in the Policy is violated). The Policy’s detail page shows its description, linked Rules, targets, violation and evaluated message counts and a history of recent violations. You can also enable (and disable) actions for the Policy from this page. The Policies page lists all of your Policies with their actions, targets and violation counts.Actions
The available actions to enable for a Policy are:- Block: when a violation occurs, prevent data from being processed or transmitted. Blocking rejects the entire Kafka record batch, which has implications for your producer application. Find out about handling blocked batches.
- Mark: when a violation occurs, add a special header to the message so it can be identified and handled downstream. Find out about how marking works.
If both Block and Mark are enabled, only blocking will be applied: messages violating the Policy will be blocked entirely with no marking.
Mark action
When the Mark action is enabled, messages that violate the Rule(s) are tagged with a special header:- Header name:
conduktor.dataquality.violations - Header value: JSON object mapping policy names to arrays of failed rule names. For example:
Violations metrics
Monitor Rule violations for a Policy over the selected time range: 30 minutes, one hour, one day or seven days.Metrics displayed
The page displays four types of metrics:- Messages evaluated count - total messages checked against this Policy
- Violations count - total violations detected
- Violations graph - a bar chart showing past violations to help identify patterns and spikes
- Violations history - individual violation events showing when and where violations occurred
Data freshness
Important: There’s a timing difference between the metrics:- Violations history - updated almost immediately
- Messages evaluated count, violations count and violations graph - may be delayed up to one minute
Create a Policy
You can create a data quality Policy using the Console UI or the Conduktor CLI.- Console UI
- Conduktor CLI
To create a Policy using the Console UI:
- Under the Trust section of the main menu, go to Policies and click +New policy.
- Define the Policy details:
- Name - add a descriptive name for the Policy.
- Technical ID - will be auto-populated as you type the name. This is used to identify this Policy in CLI/API.
- Group - select a group to own the Policy. This controls who can view and manage the Policy, and which resources can be targeted.
- Description - (optional) enter a description to explain your Policy.
- Select Rules to be used in the Policy:
- Every Policy must have at least one Rule
- You can also create new Rules from this page
- Click Continue to move to the next step.
- Select targets for the Policy:
- Every Policy must have at least one target
- A target consists of one or more topics on a specified Gateway
- You can either select specific topics or specify a prefix like
orders-* - Click Continue to move to the next step.
- Review the Policy and when ready, confirm by clicking Create.
Manage a Policy
Once a Policy is created, you can view the attached Rule(s), the target(s) of the Policy and change the related actions. You can also view the violations as they occur and the violation count will be shown. To edit the list of Rules attached to a Policy, click Edit selection on the Policy details page. In the dialog that opens, select/deselect the required Rules from the list and save changes.Since the block action has the ability to stop data from being sent to the requested topic, you have to confirm this by entering ‘BLOCK’ when prompted. Conversely, to disable the blocking, enter ‘UNBLOCK’ when prompted.
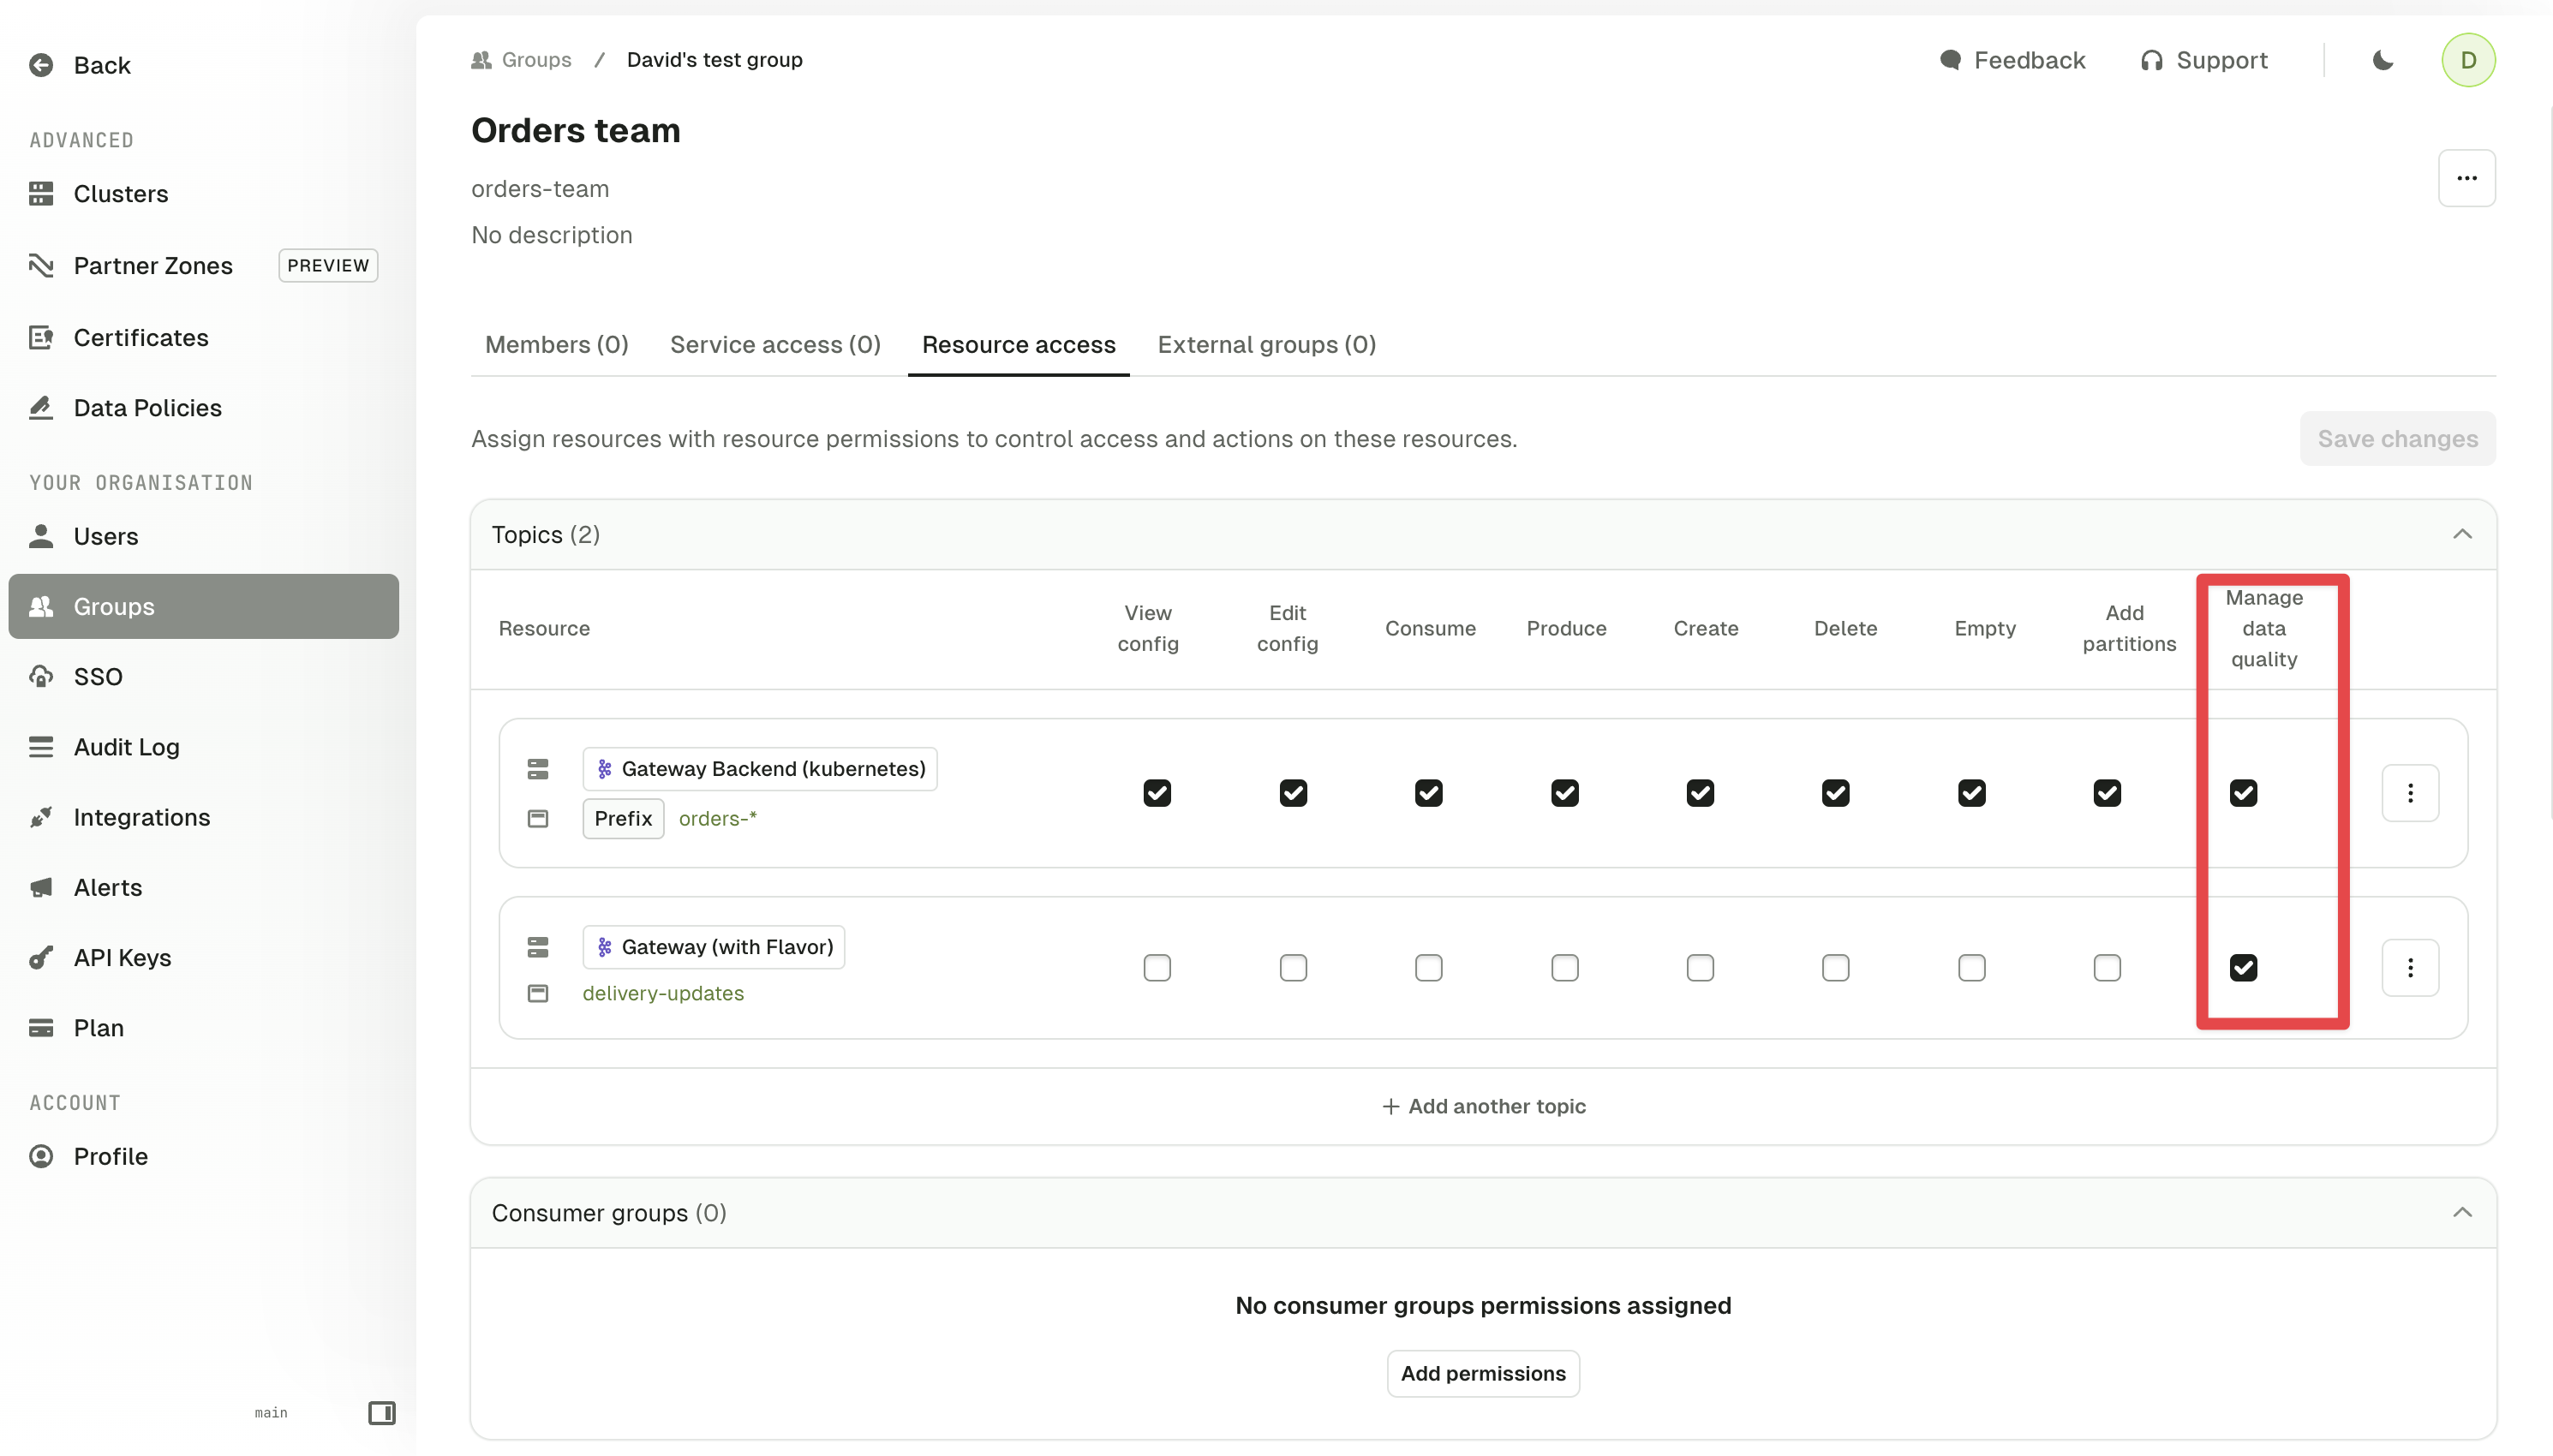
Assign permissions
Policies are owned by user groups and can be created by admin users or groups with the Manage data quality permission. To apply this permission to a group: go to Settings > Groups and in the Resource access tab tick the Manage data quality checkbox for the relevant resources.Make sure to enable this on the Gateway (and not the underlying Kafka) cluster. Modifying group permissions won’t affect any Policies associated with the group.
Set up Policy violation alerts
You can create alerts that are triggered when a Policy violation happens. Data quality alerts can be owned by groups or individual users.- Console UI
- Conduktor CLI
To create a data quality policy alert via the UI, go to the details page of a Policy (click on the button next to the violations graph) or from the alert tab on the Policies list page.A data quality policy alert needs to specify a Policy and a threshold: trigger after X violations within Y minutes/hours/days. This threshold replaces the combination of metric, operator and value used in other alerts.Find out more about alerts.
Using multiple Policies
When multiple Policies target the same topic, there are two scenarios that can occur when a record is produced:-
None of the Policies block the record and all are evaluated
- The evaluation count is increased for all of the Policies.
- The violation count is increased for each violated Policy.
- An entry will appear in the violation history for each violated Policy.
-
One or more of the Policies block the record production. In this scenario, one of the Policies blocks the record first and then hides it from others
- For the first blocking Policy, both the violation and evaluation counts are increased and a report is generated.
- For the other Policies: no counts are increased and no reports are generated.
Troubleshoot
What does Policy status mean?
What does Policy status mean?
This is the status of a data quality Policy:
- Pending: the configuration isn’t deployed or refreshed yet
- Ready: the configuration is up-to-date on Gateway
- Failed: something unexpected happened during the deployment. Check that the connected Gateway is active.
How do I handle headers with dashes?
How do I handle headers with dashes?
Use bracket notation instead of dot notation. For example:
headers['Content-Type']Why can't `type()` figure out the right numeric types?
Why can't `type()` figure out the right numeric types?
Whether your data is sent as JSON or Avro, Conduktor Gateway internally converts the payload to JSON before applying CEL rules. In JSON, all numeric values are treated as a generic
number — there’s no distinction between int and double. As a result, expressions like type(value.age) == int may fail unexpectedly, even if:- the original value is a valid integer (e.g., 12)
- you’re using an Avro schema where age is explicitly entered as an integer
value.age > 0 && value.age < 130 This implicitly checks that the field is numeric and falls within a valid range, avoiding type inference.Note: CEL currently can’t evaluate against Avro schemas directly — it only sees the JSON-converted payload.We recommend enabling Gateway debug logs to inspect how data is interpreted during rule evaluation and to understand why it may have failed.Why can't I mix Gateway and non-Gateway targets in a single policy?
Why can't I mix Gateway and non-Gateway targets in a single policy?
You can directly target topics on Kafka clusters without Gateway with Policies, but actions require Gateway.Since the targeted cluster type affects the capabilities of data quality Policies, you can’t create a Policy with a mixture of target types.Find out about the differences in data quality policy capabilities with and without Gateway.