console-cortex component.
Configure
Metrics collection
Your external monitoring solution has to be configured to scrape Console metrics from the/api/monitoring/metrics endpoint.
Example Prometheus scrape configuration:
Basic auth for metrics scraping
Since Console v1.42.0, you can configure basic auth credentials to protect access to Console metrics. When configured, your monitoring backend must provide these credentials in order to scrape metrics from the/api/monitoring/metrics and /monitoring/metrics/ endpoints.
Basic auth is optional in Console v1.42.0 and no configuration changes are required for existing deployments.
Multi-tenancy support
If your Cortex or Mimir instance has multi-tenancy enabled, you can configure the tenant ID using:X-Scope-OrgId header for authentication.
Alerting system
If you configure a Cortex or Mimir integration, you can also set up Alertmanager for Console alerts. Alternatively, Console will use its own built-in alerting system. Because Prometheus doesn’t support configuration of alert rules via API, Console will always use its own built-in alerting system. When configuring Alertmanager, Console will override the Alertmanager configuration. If you share the same Alertmanager instance with other applications, you have to ensure that multi-tenancy is enabled and that Console has a dedicated tenant.Configuration examples
Cortex
Mimir
Prometheus
Troubleshooting
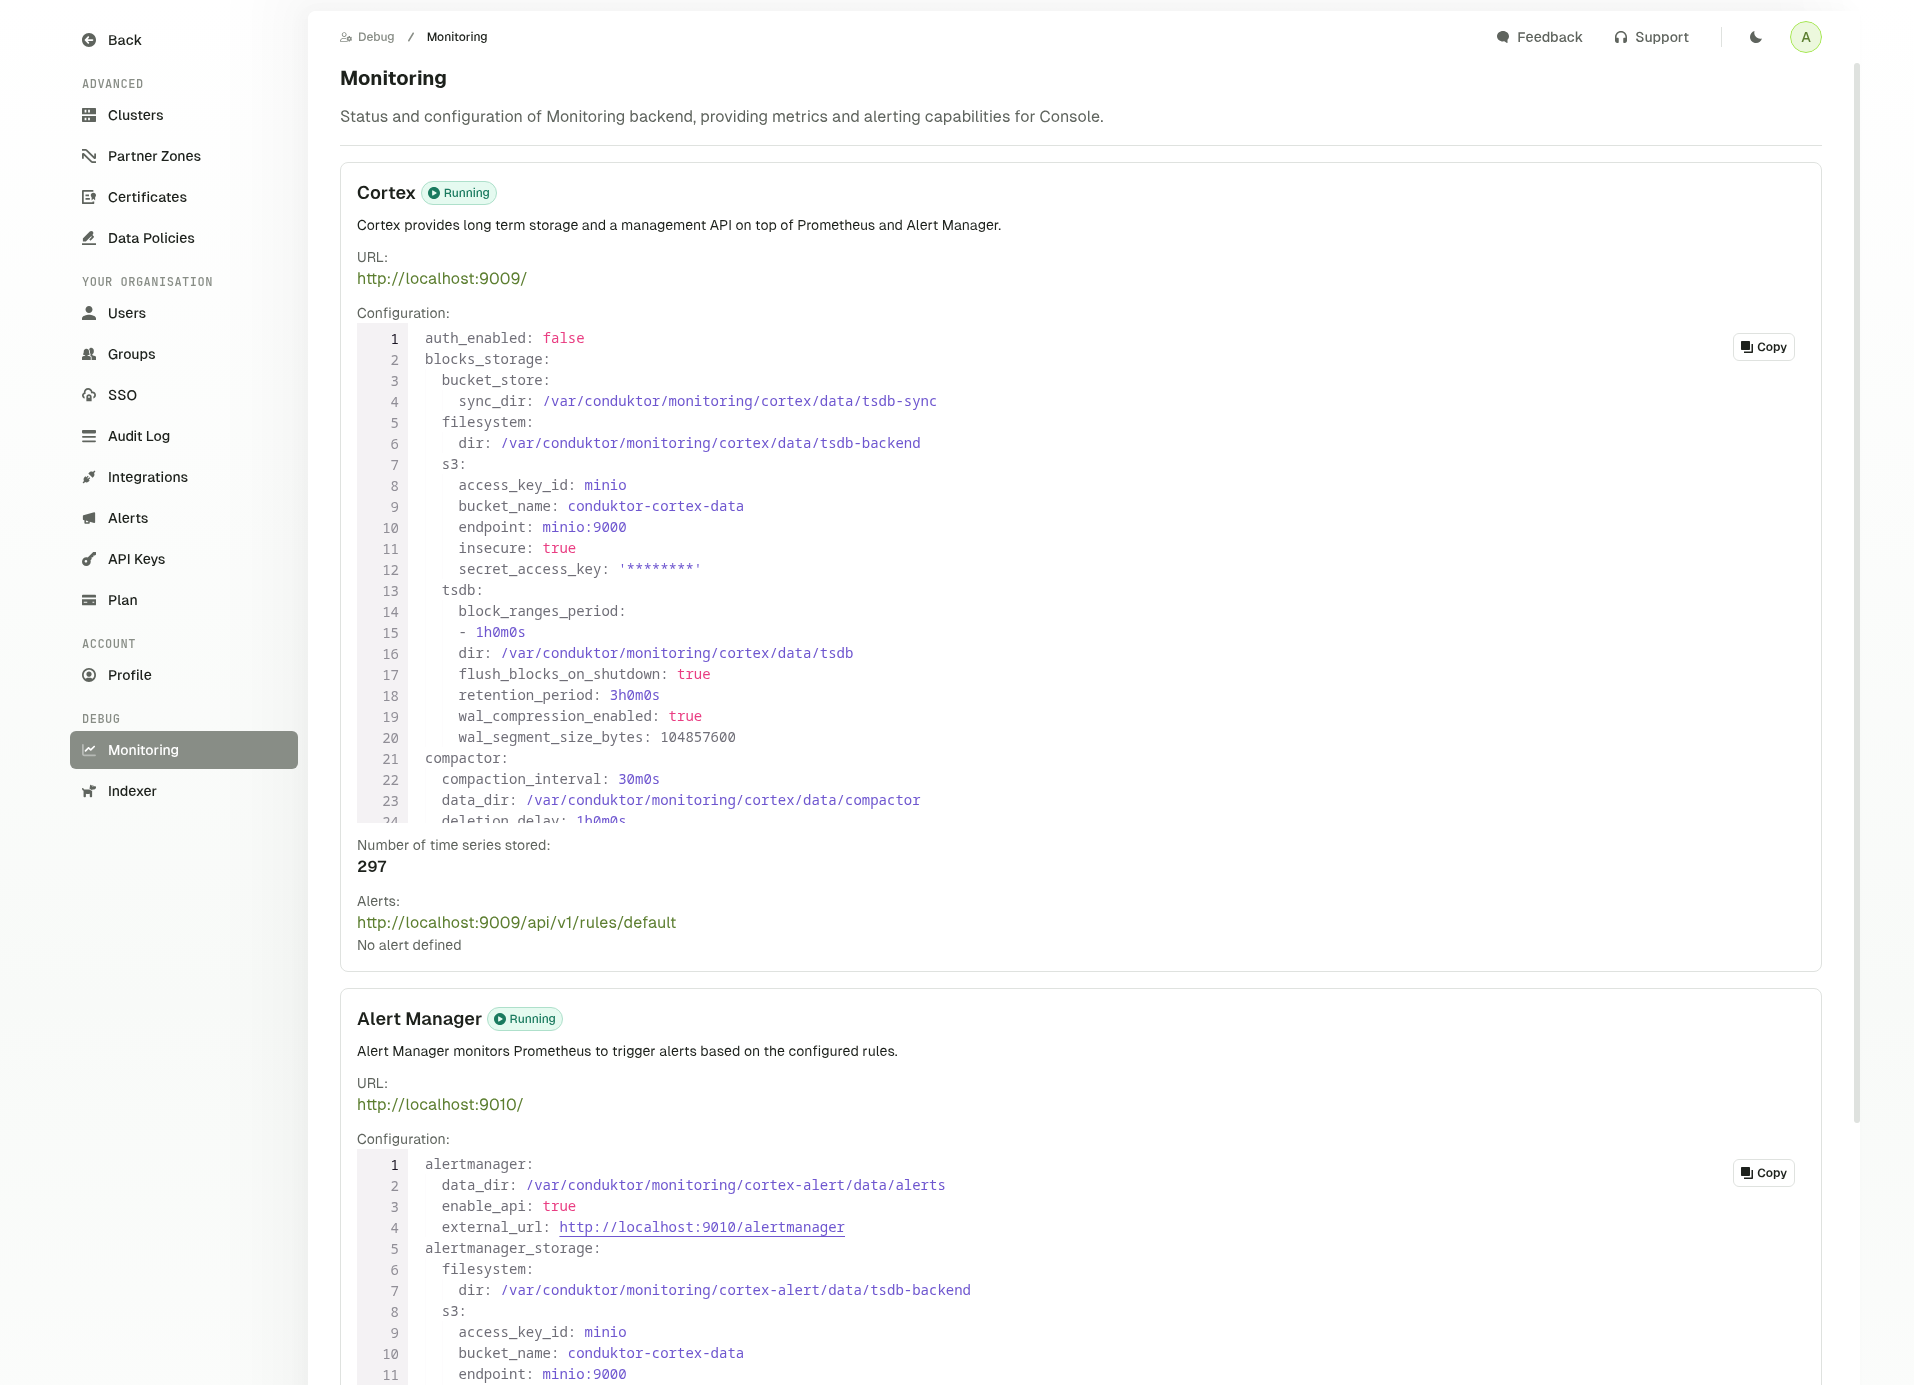
Monitoring debug page
Console provides a dedicated troubleshooting page for administrators to diagnose monitoring connectivity issues. Access this page at:/settings/debug/monitoring
This debug page shows:
- Connectivity status to your monitoring solution
- Current configuration settings
- Metrics collection statistics