

gateway_latency_request_response) tells you a request was slow, but not where it was slow. When latency spikes, you are left choosing between thread dumps and profilers to work out whether the bottleneck is in Gateway authorization, an Interceptor, the upstream queue, or Kafka itself.
Request lifecycle metrics help identify where requests and responses spend most of their time. They split each request into 11 timed segments — from the moment Gateway reads a request off the client socket to the moment it writes the response back — each exposed as a Prometheus histogram tagged by Kafka API key and Interceptor name (when applicable).
Lifecycle metrics are disabled by default because they add high-cardinality series to your Prometheus. Enable them when you need a per-stage breakdown, and scope them to the API keys and Interceptors you care about.
Enable lifecycle metrics
Set the master switch totrue:
Scope the metrics
Once enabled, all 11 metrics record for every Kafka API key, and the two per-Interceptor metrics record for every Interceptor. That’s the highest-cardinality configuration. You can narrow it with the settings in Lifecycle metrics scoping. A few Kafka API keys, mainlyPRODUCE and FETCH, carry most of the traffic. Most of the others are administrative and send few requests, so their charts are nearly empty. Scope the API keys to the ones you want to investigate.
Valid API keys are the ApiKeys enum constant names — uppercase with underscores, such as PRODUCE, FETCH, and OFFSET_COMMIT (not the CamelCase protocol names like OffsetCommit). They’re case-insensitive. If you set a name Gateway doesn’t recognize, it fails to start and logs the full list of valid values. The following table suggests API keys for each monitoring goal:
For example, to scope the metrics only for the data path and two Interceptors,
encrypt and decrypt, set the following configuration:
Configure with the Helm chart
If you deploy Gateway with the Conduktor Helm chart, enable and scope the metrics through themetrics.lifecycle values rather than setting the feature flag or environment variables yourself:
metrics.lifecycle.enable: true emits GATEWAY_FEATURE_FLAGS_LIFECYCLE_METRICS=true for you. The chart emits GATEWAY_LIFECYCLE_METRICS_API_KEYS and GATEWAY_LIFECYCLE_METRICS_INTERCEPTORS only when you set apiKeys or interceptors to a value other than ALL.
metrics.lifecycle.enable works independently from metrics.grafana.enable. When you enable both, the chart deploys the three Grafana dashboards automatically, alongside the main Gateway dashboard.
The request lifecycle
The following diagrams show the lifecycle of a single request/response inside Gateway. Each arrow is one timed segment, labeled with the metric that records it and the boundary it spans. The edge labels drop the common metric prefix and suffix: prependgateway.request. to each segment label in the request path and gateway.response. in the response path, and append .duration to all of them (so preprocess is gateway.request.preprocess.duration).
The request path runs from the client read (T0) through the round-trip to Kafka (T6):
The response path runs from the Kafka response (T6) back to the client write (T10):
gateway.request.total.duration spans the whole path, T0 -> T10.
Each boundary marks a lifecycle event:
Request/response rebuilding refers to unpacking Kafka requests and responses, then modifying them for Gateway features such as encryption, Virtual Clusters, and cluster switching. Gateway then sends the modified request to the Kafka cluster, or the modified response back to the client.
Lifecycle stages and metrics
In Prometheus, these metrics use underscores instead of dots and end in_seconds, so gateway.request.preprocess.duration is scraped as gateway_request_preprocess_duration_seconds with _bucket, _sum, _count, and _max series. Following are the metric names in Prometheus:
The
interceptor label is the Interceptor’s configured name (for example encrypt or guard-schema-payload-validate), not its plugin class.How to read the metrics
Three useful ways to read each metric:- Mean:
rate(_sum) / rate(_count)._sumis the total time of all requests and_countis how many requests there were. - Worst case:
_max, the slowest recent request. - Share of requests over a threshold: for example,
1 - rate(_bucket{le="0.1"}) / rate(_count)gives the share that took longer than 100ms. This is the form the dashboards use.le(“less than or equal to”) is in seconds.
Grafana dashboards
Conduktor ships three ready-made dashboards based on these request lifecycle metrics, at charts/gateway/grafana-dashboards. If you deploy Gateway with the Conduktor Helm chart and enable bothmetrics.lifecycle.enable and metrics.grafana.enable, the chart deploys these three dashboards for you, alongside the main Gateway dashboard. See Configure with the Helm chart.
Otherwise, import them into Grafana manually and select your data source, job, and pod at the top of each.
Conduktor Gateway Lifecycle - Overview
This dashboard has four sections. The first two give an overview, and the last two show each stage in detail.Overview per API key
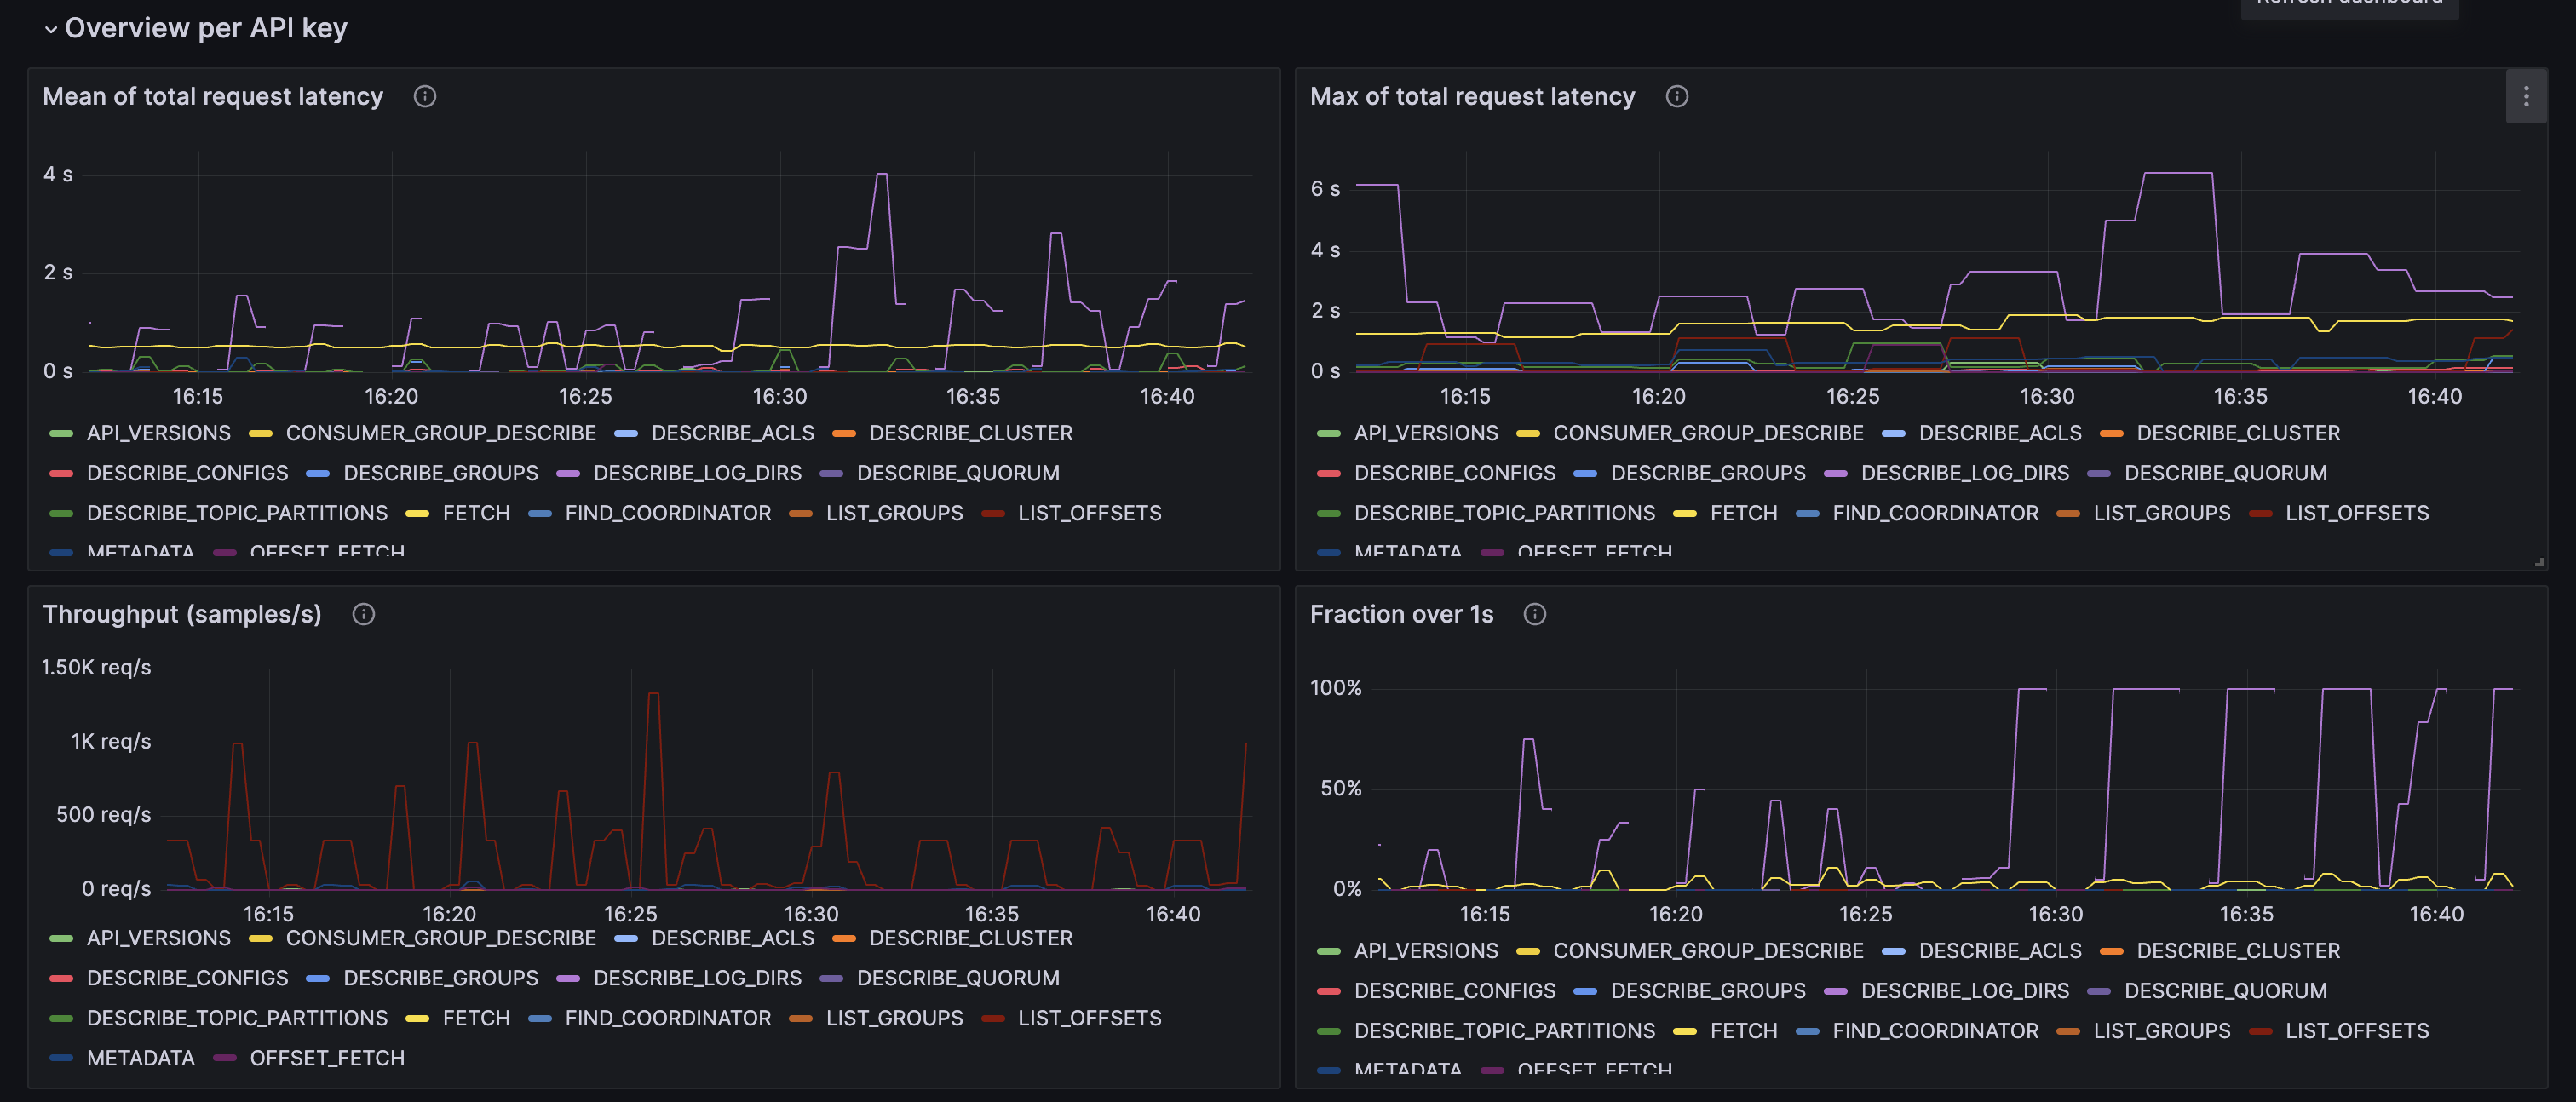
Total request latency (T0 -> T10), with one line per API key. The four panels show the mean, the max, the throughput, and the share of requests slower than 1s.
In the following screenshot, DESCRIBE_LOG_DIRS stands out: its mean latency spikes to several seconds, and at times all of its requests take longer than 1s. The other API keys stay under a second.
Overview per stage
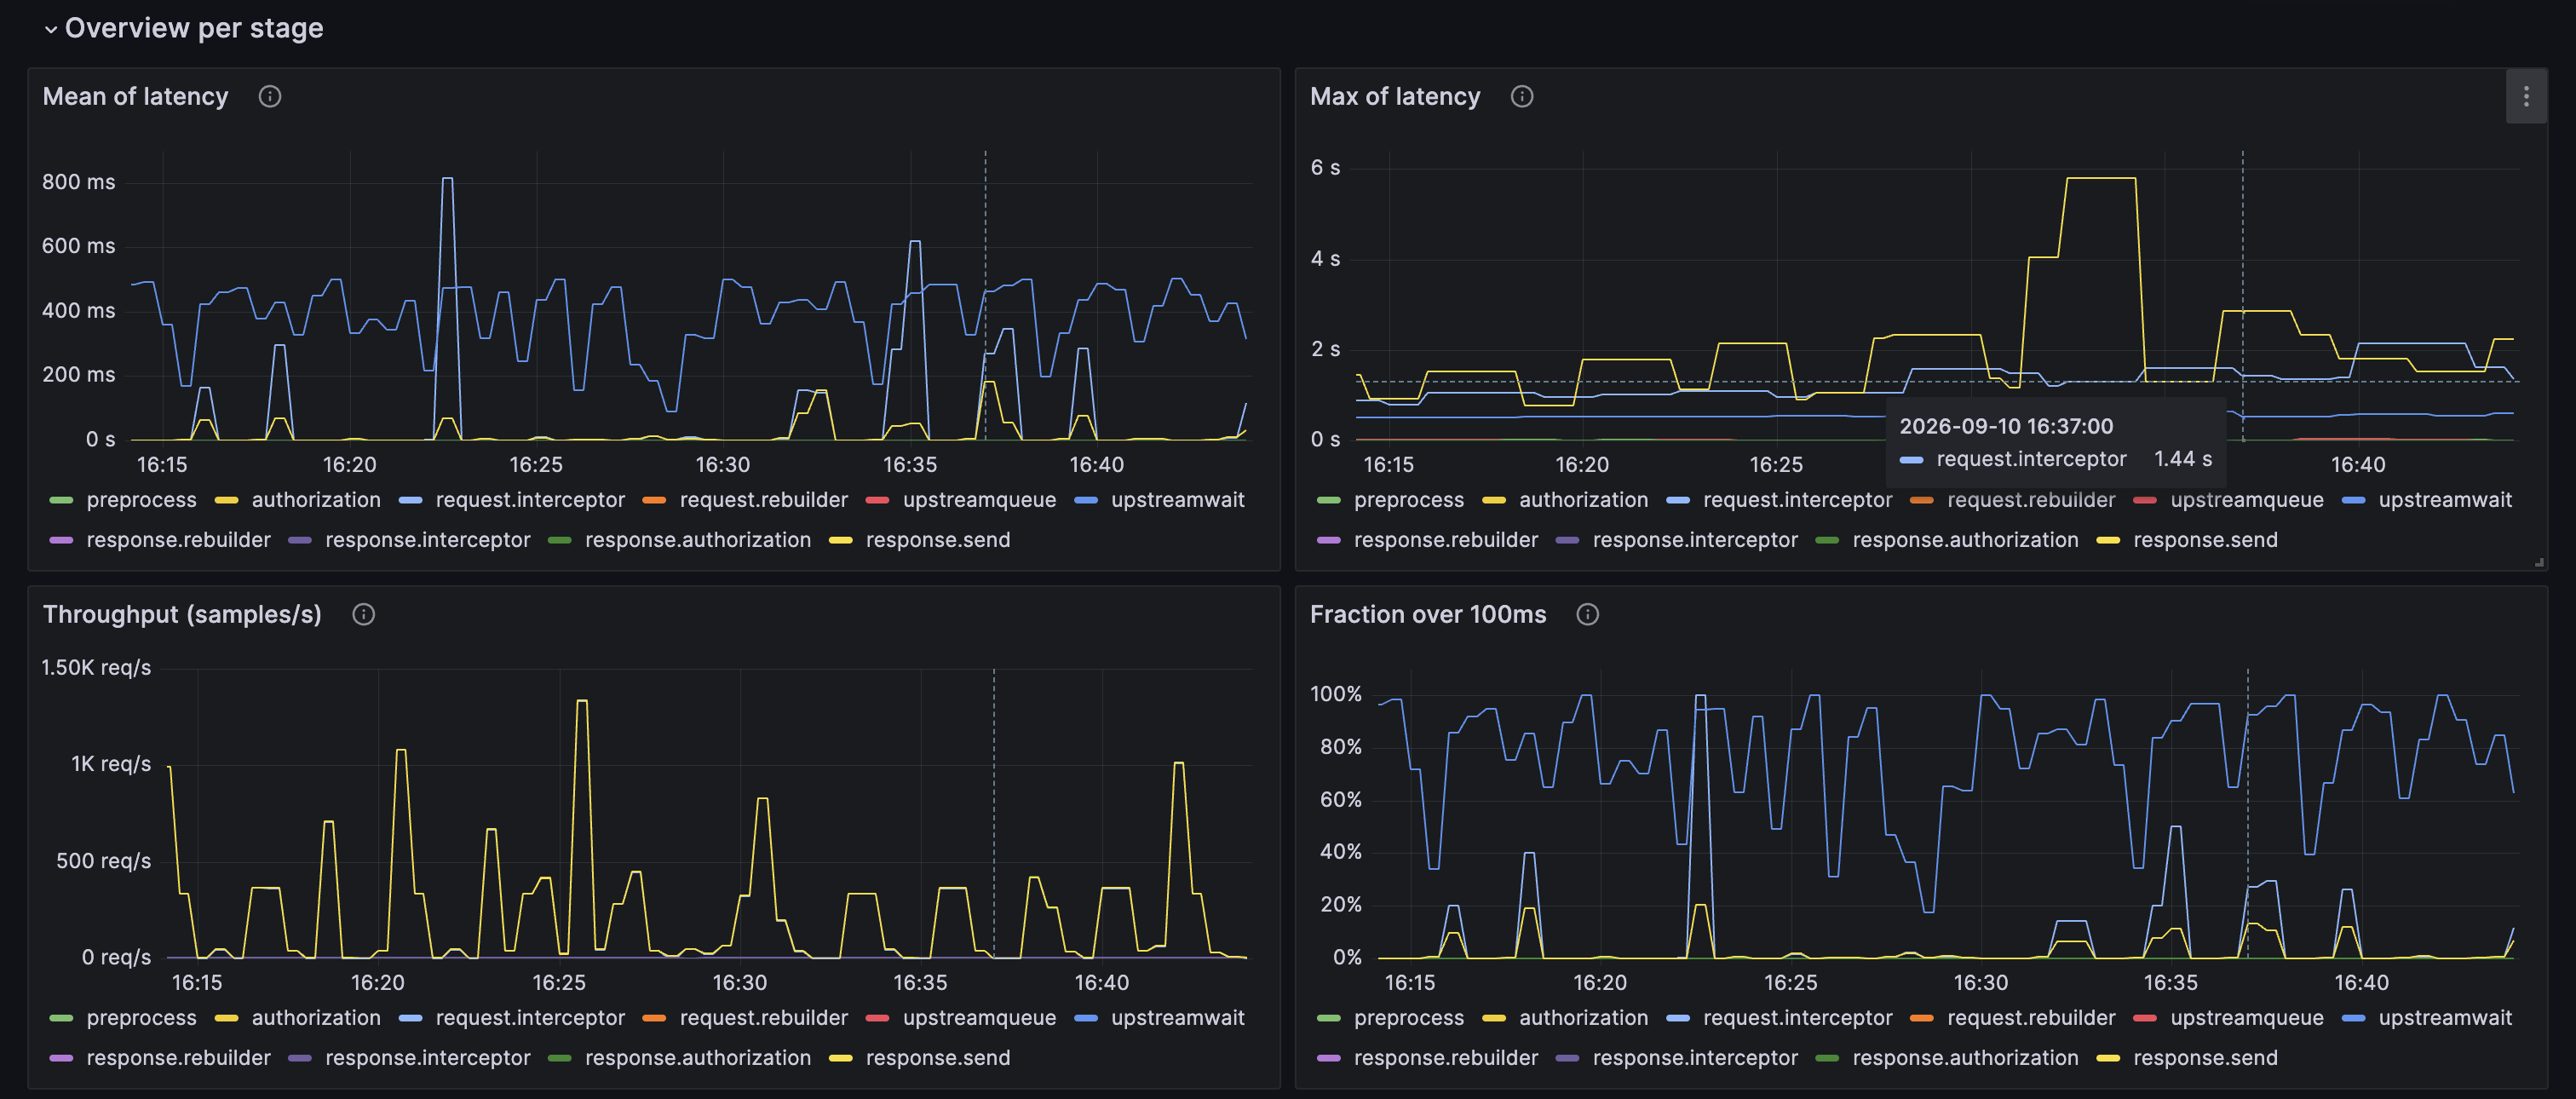
The same four panels for each stage, with one line per stage. Here the threshold is 100ms. In the following screenshot, most latency sits in theupstreamwait stage of FETCH requests — the time Gateway waits for Kafka. Its mean runs 100–500ms: Kafka holds a FETCH request for up to fetch.max.wait.ms (default 500ms) when no new message arrives. request.interceptor spikes occasionally, and the other stages stay near zero.
Request path and Response path
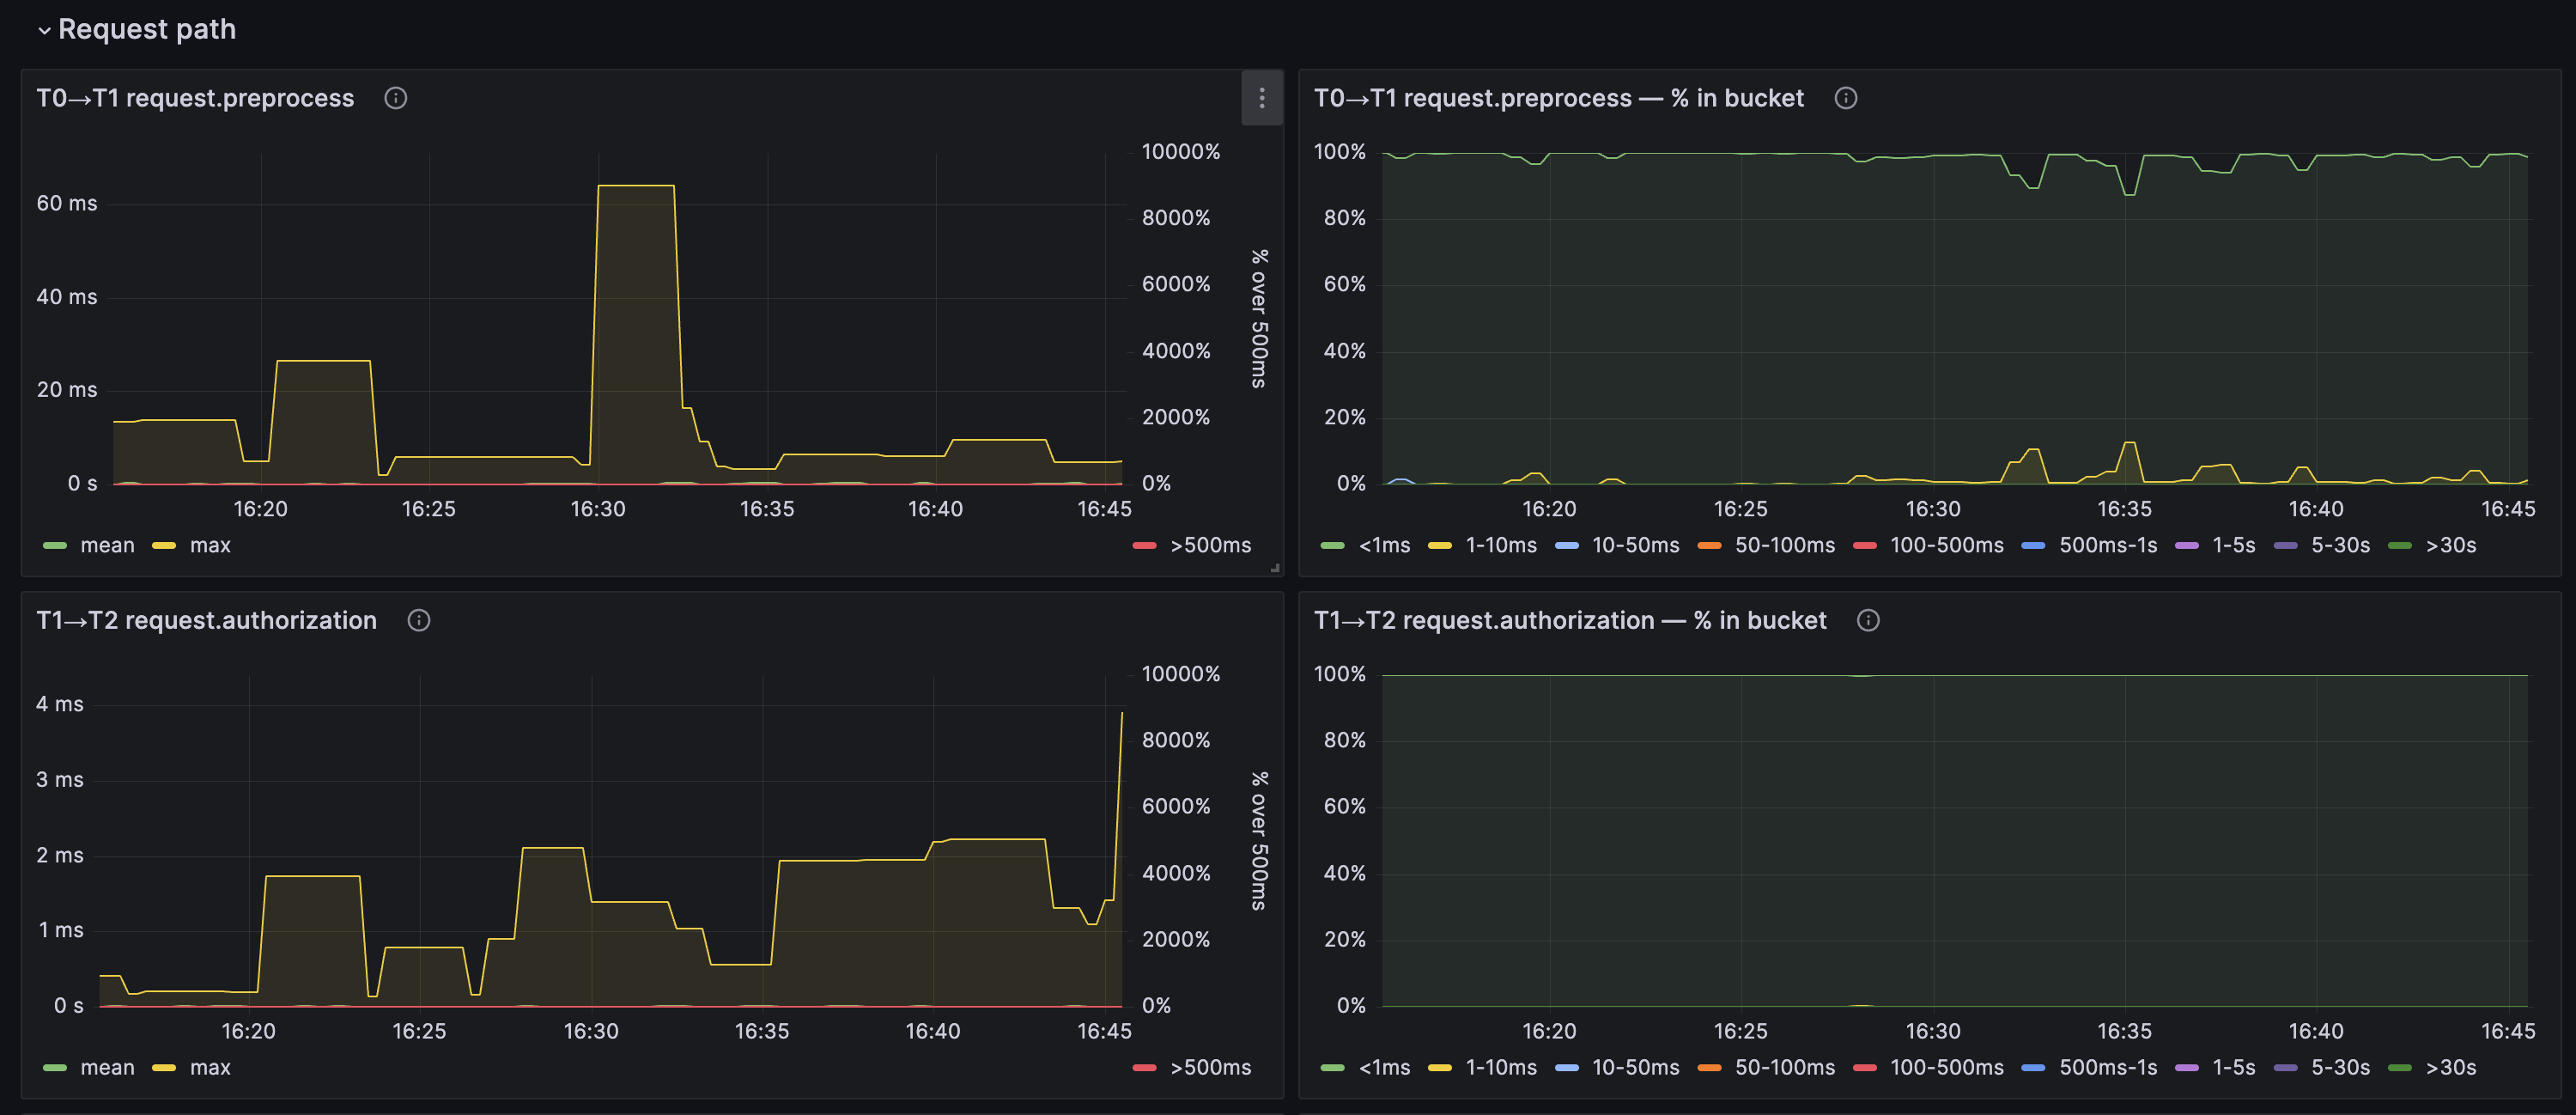
Each stage has its own panel showing the mean, the max, and the share of requests slower than 500ms. A ”% in bucket” panel next to it shows how that stage’s latency spreads across the histogram buckets. In the following screenshot, which shows the first two stages of the request path, nearly allrequest.preprocess requests take under 1ms, though the max reaches about 60ms. Every request.authorization request takes under 1ms.
Conduktor Gateway Lifecycle - by API key
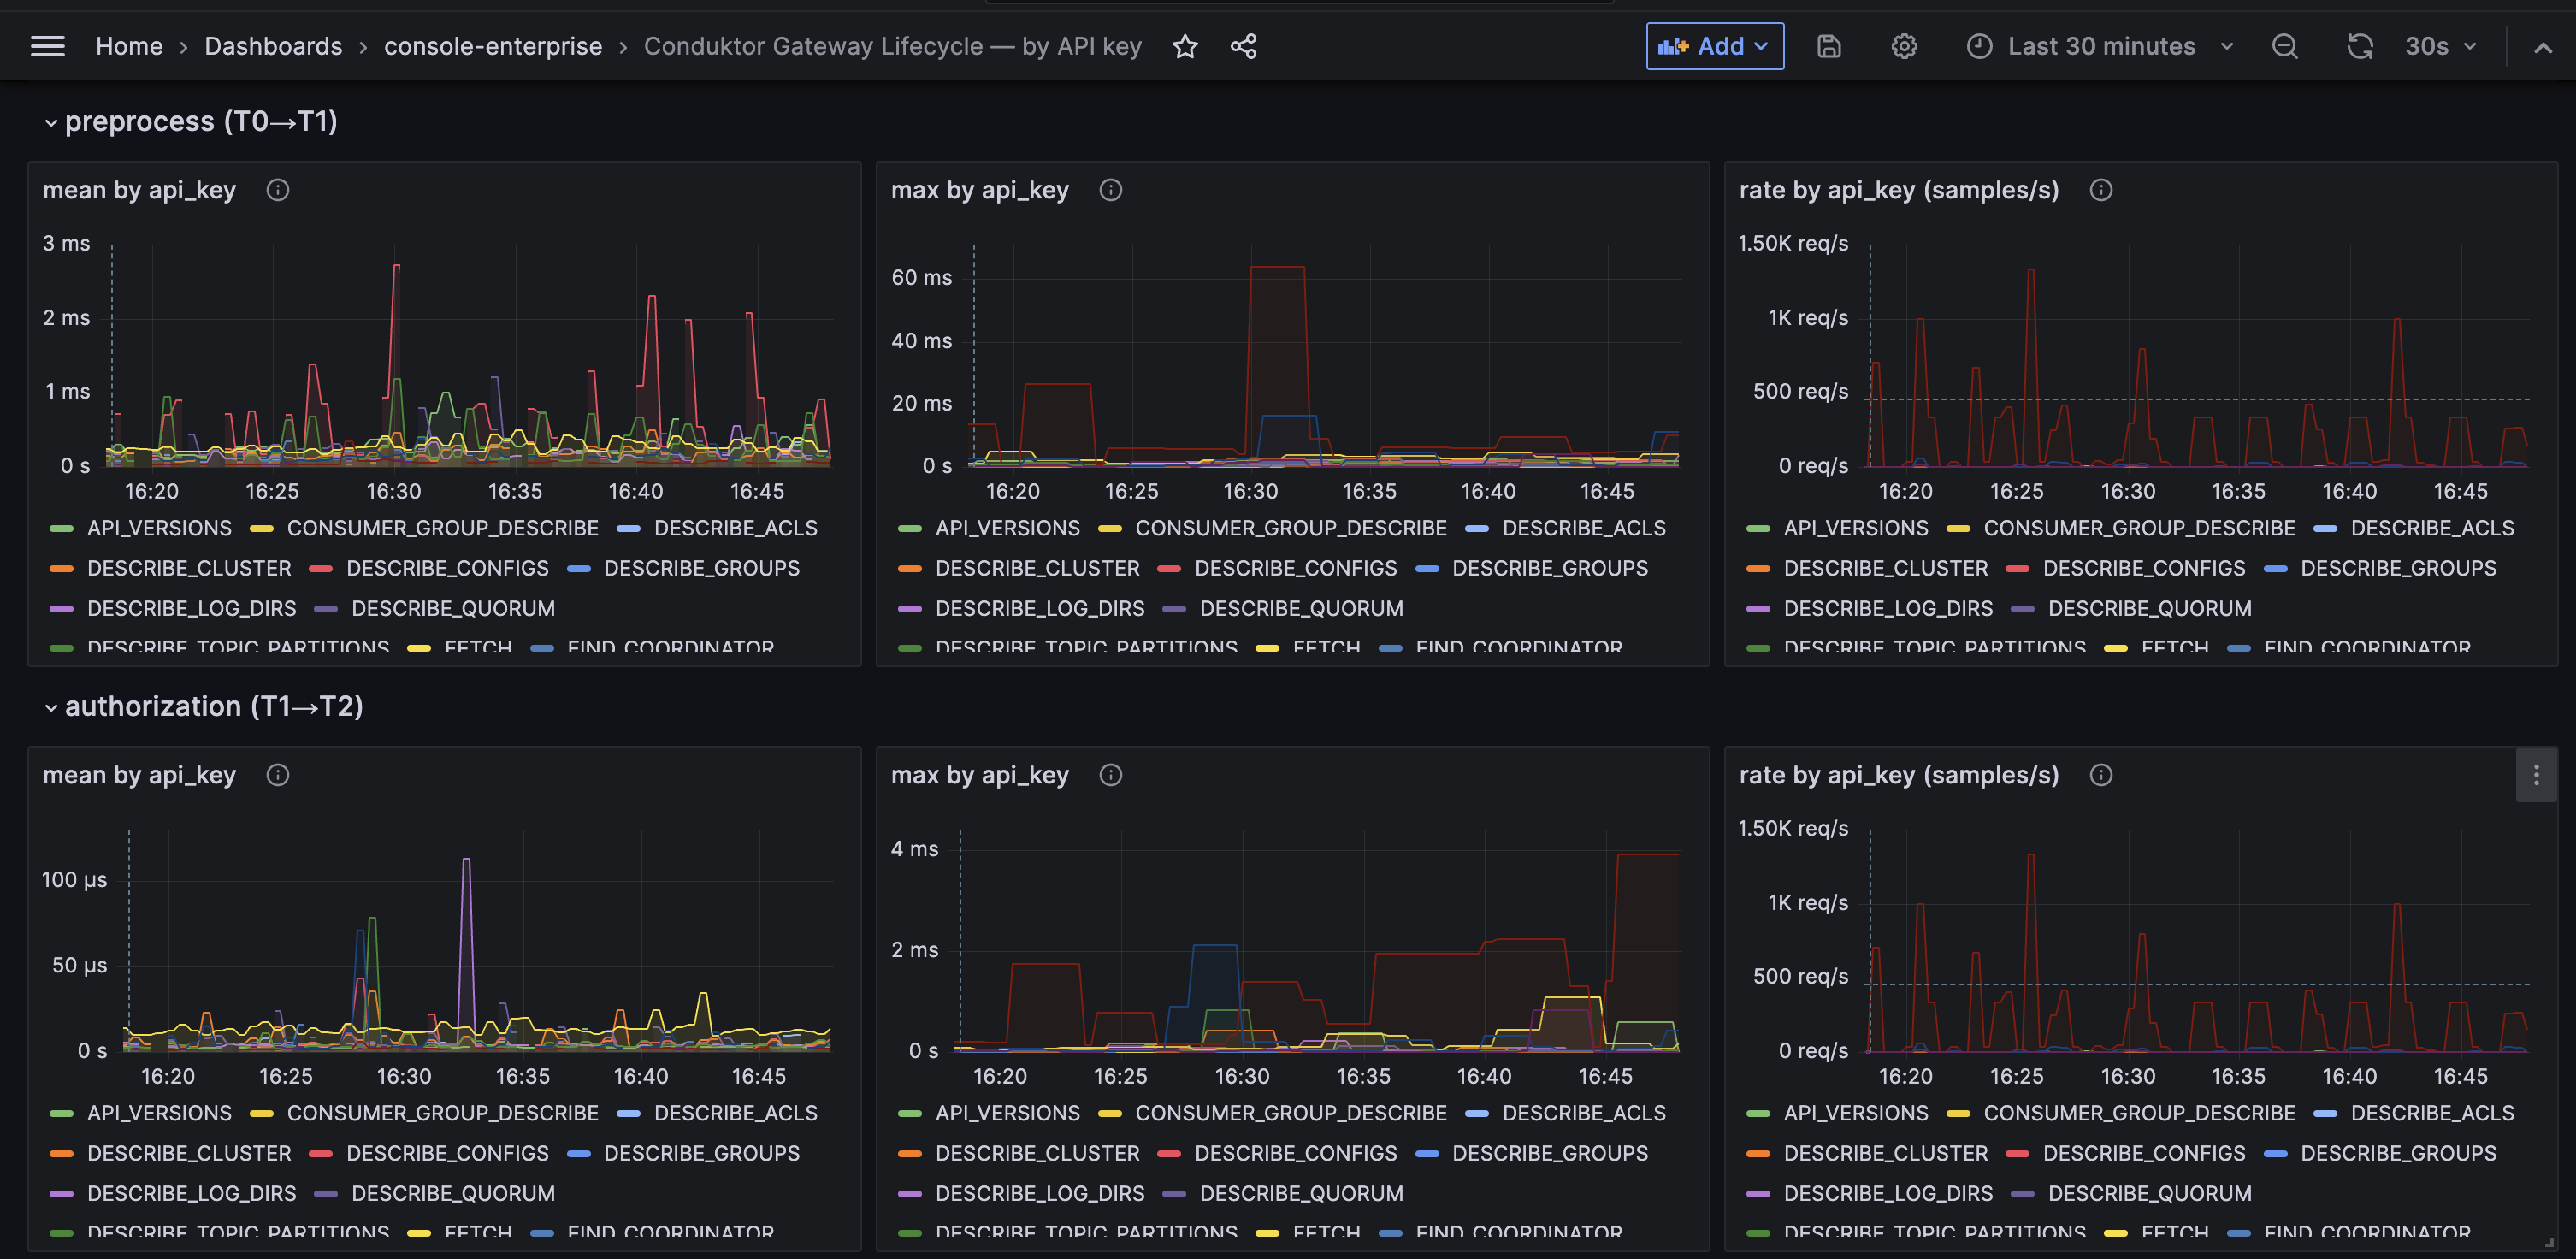
The dashboard has one section for each stage, plus a total (T0 -> T10) section at the end. Each has three panels, with one line per API key: the mean, the max, and the rate. Use it to spot an API key that’s slow in one stage, for example aFETCH that lags in upstreamwait while the other API keys stay flat. Use the API key dropdown to focus on a single API key. A section shows “No data” when no API key runs at that stage.
In this example, which shows the first two sections, every API key is fast in both stages: the preprocess (T0 -> T1) mean stays under 3ms and the authorization (T1 -> T2) mean under about 120µs. The max has occasional spikes, up to about 65ms for preprocess and 4ms for authorization.
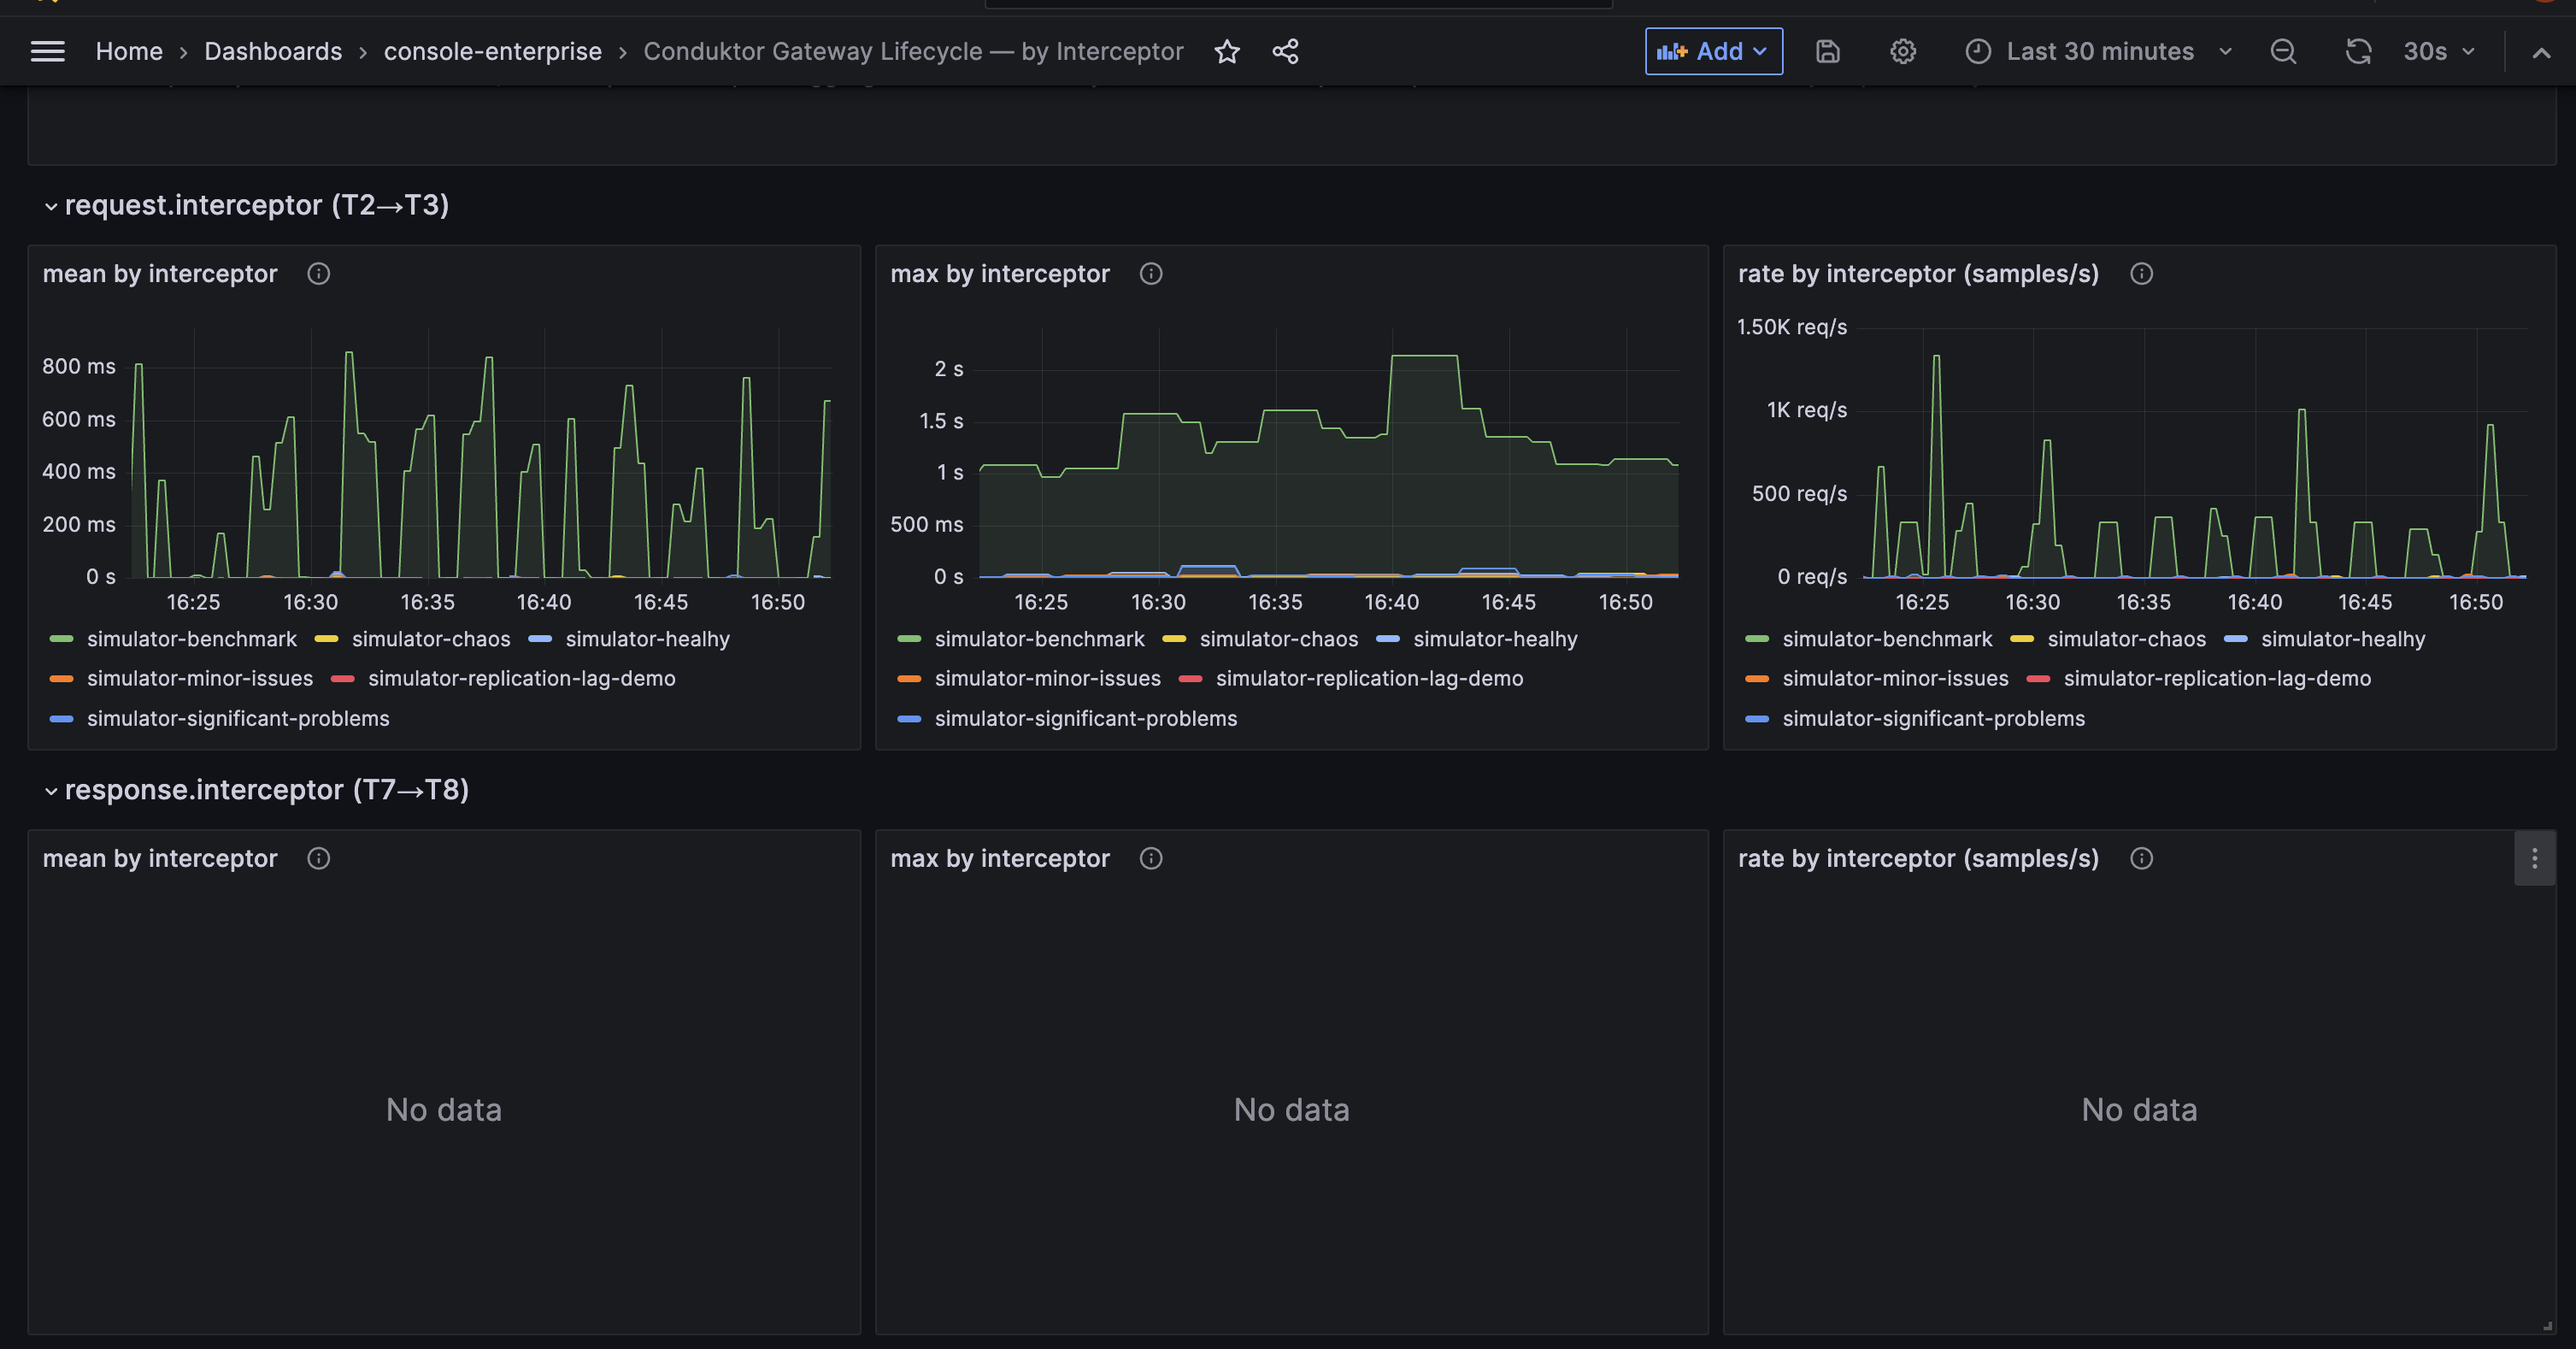
Conduktor Gateway Lifecycle - by Interceptor
This dashboard has two sections, one for each Interceptor stage: request.interceptor (T2 -> T3) and response.interceptor (T7 -> T8). Each has three panels, with one line per Interceptor: the mean, the max, and the rate of Interceptor runs. Use theinterceptor dropdown to focus on a single Interceptor. A section shows “No data” when no Interceptor runs at that stage.
In this example, simulator-benchmark stands out on the request path: its mean spikes to about 800ms and its max stays between 1s and 2s, while the other Interceptors stay close to zero. None of the Interceptors run on responses, so the response section shows “No data”.
When metrics don’t fire
Not every request runs the fullT0 -> T10. Denials (from authorization checks or Interceptors), failures, timeouts, and cache hits cause the request to leave the lifecycle at different points. Therefore, a stage with no samples likely means the traffic never reached that stage. The common cases:
Examples of how to use the above table:
- A very low mean for
gateway_request_total_duration_secondspoints to denials, short-circuits, or cache hits, which complete quickly with no Kafka round trip. A cache hit still recordsresponse.send, but a denial or short-circuit doesn’t — sorate(response.send)close torate(request.total)means cache hits, while a gap between them counts denials, short-circuits, timeouts, and response-side failures. - A rising
_max, or a growing share of requests over 30s (1 - rate(gateway_request_total_duration_seconds_bucket{le="30"}) / rate(gateway_request_total_duration_seconds_count)), points to in-flight timeouts waiting for a response from upstream Kafka. Gateway expires these afterGATEWAY_INFLIGHT_REQUEST_EXPIRY_MS(default 330s) andrequest.totalrecords the full wait. A few timeouts barely move the mean, so read the tail rather than the average. A broker disconnect looks different — the abandoned requests record norequest.totaland instead show up as a delayed rise ingateway.request_expiredabout 330s later.
Control cardinality
Each metric carries tags, and every tag combination creates a separate metric instance — the metric’s cardinality. For example,gateway_request_total_duration_seconds with api_key=PRODUCE and with api_key=FETCH counts as two instances. The api_key tag is bounded (77 client-facing Kafka API keys, around 25 in common use), but the interceptor tag isn’t, so your Interceptor count drives cardinality the most.
Each instance also generates 12 Prometheus series — nine latency buckets plus _count, _sum, and _max — and every series consumes memory.
The table below shows the cardinality for 25 or 77 API keys and 0, 1, or 10 Interceptors. Each Interceptor is counted on the request path only; one that also runs on the response path counts twice.
The Interceptor tag drives growth fastest, so to reduce cardinality scope the metrics with
GATEWAY_LIFECYCLE_METRICS_INTERCEPTORS first, then narrow the API keys with GATEWAY_LIFECYCLE_METRICS_API_KEYS.
Relationship to existing metrics
gateway_latency_request_response and gateway_apiKeys_latency_request_response measure a narrower window, roughly T5 -> T9, than gateway_request_total_duration_seconds, which covers the full T0 -> T10 pipeline. Use the lifecycle metrics for per-stage analysis and these two for the high-level view.