Learn how to monitor Kafka clusters and master essential operations in 15 minutes Effective monitoring is critical for running Kafka reliably. This guide covers how Kafka exposes metrics, which metrics to prioritize, and the operational procedures you need to master. What you’ll learn:Documentation Index
Fetch the complete documentation index at: https://docs.conduktor.io/llms.txt
Use this file to discover all available pages before exploring further.
- How Kafka exposes metrics via JMX
- Key metrics to monitor for cluster health
- Common monitoring tools and integrations
- Essential operational procedures
Kafka monitoring
Kafka runs on the JVM and exposes all metrics via Java Management Extensions (JMX). You can collect these metrics using agents that attach to the Kafka process.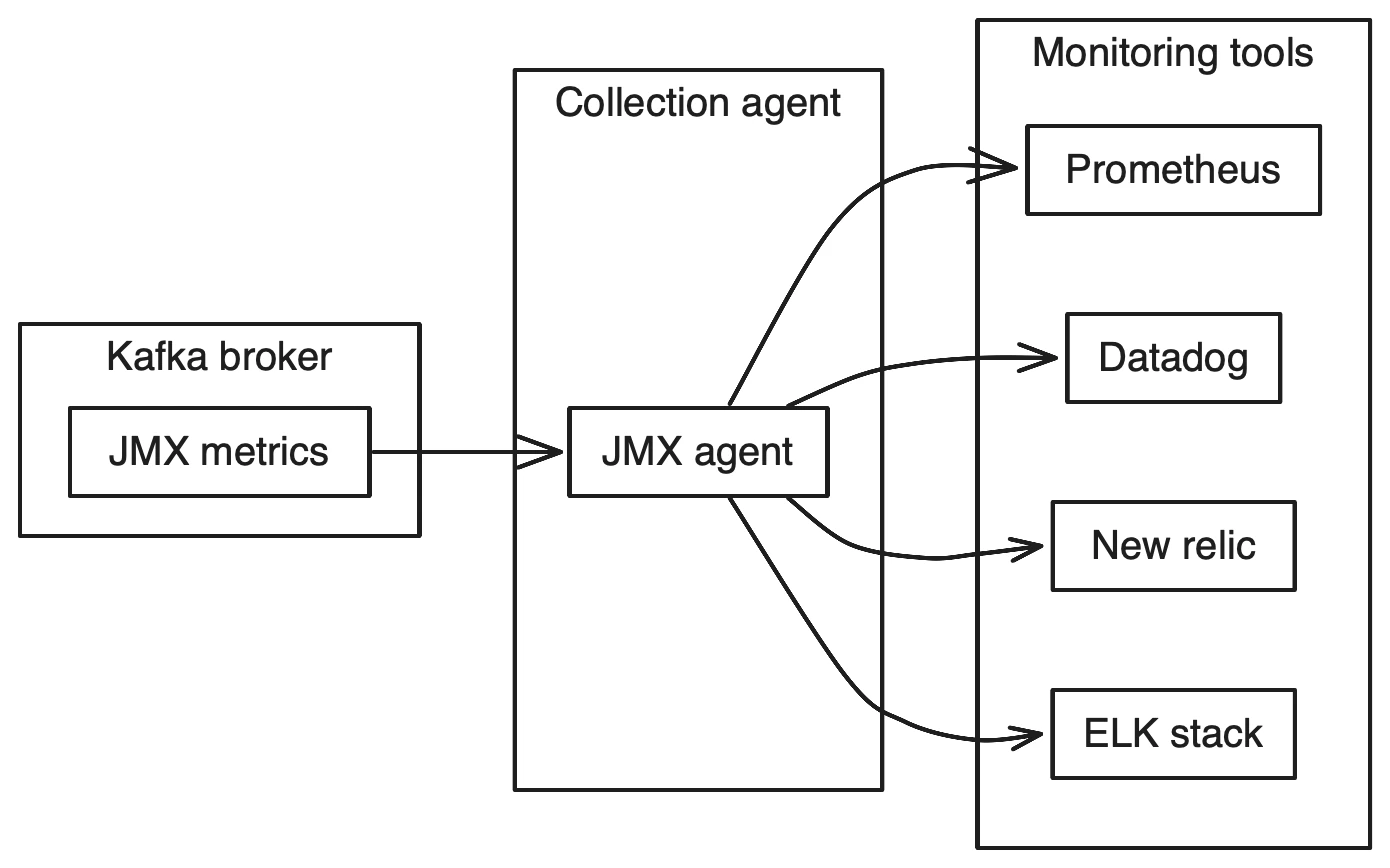
| Tool | Type | Notes |
|---|---|---|
| Prometheus | Open source | Popular with Grafana dashboards |
| Datadog | SaaS | Built-in Kafka integration |
| New Relic | SaaS | APM with Kafka support |
| ELK Stack | Open source | Log aggregation + metrics |
| Confluent Control Center | Commercial | Kafka-specific tooling |
Kafka metrics to monitor
| Metric | Description | Alert threshold |
|---|---|---|
| UnderReplicatedPartitions | Partitions where followers are behind leader | > 0 for extended periods |
| OfflinePartitionsCount | Partitions with no available leader | > 0 (critical) |
| ActiveControllerCount | Number of active controllers | != 1 (critical) |
| RequestHandlerAvgIdlePercent | Thread pool utilization | < 20% |
| RequestQueueSize | Pending requests | Growing over time |
| NetworkProcessorAvgIdlePercent | Network thread utilization | < 30% |
| LogFlushLatency | Time to flush to disk | > baseline |
| FetchConsumerTotalTimeMs | Consumer request latency | > baseline |
| ProduceTotalTimeMs | Producer request latency | > baseline |
References
There are many metrics exposed by Kafka providing information about nearly every function. To learn more about them, these references are very helpful:- https://kafka.apache.org/documentation/#monitoring
- https://docs.confluent.io/current/kafka/monitoring.html
- https://www.datadoghq.com/blog/monitoring-kafka-performance-metrics/
Kafka cluster operations
For the day-to-day operations of Kafka, there are a number of operations that one has to learn and master to be able to perform them safely. These include:- Rolling Restart of Brokers
- Updating Configurations
- Rebalancing Partitions
- Increasing replication factor
- Adding a Broker
- Replacing a Broker
- Removing a Broker
- Upgrading a Kafka Cluster with zero downtime
See it in practice with ConduktorConduktor Console provides built-in monitoring for broker health, partition status, consumer lag, and throughput metrics. Set up alerts without configuring JMX agents or external monitoring systems.The Insights dashboard analyzes your cluster and identifies topics at risk of data loss, poor cluster efficiency or load imbalance. Monitor business-critical VIP topics and track governance metrics like schema adoption across your infrastructure.
Next steps
- Configure security for your cluster
- Plan for upgrades with monitoring in place
- Set up multi-cluster replication