Learn how to optimize producer throughput with batching in 12 minutes Kafka producer batching groups multiple messages together before sending them to brokers, dramatically improving throughput at the cost of slightly increased latency. Understanding batching is essential for building high-performance producer applications. What you’ll learn:Documentation Index
Fetch the complete documentation index at: https://docs.conduktor.io/llms.txt
Use this file to discover all available pages before exploring further.
- How producer batching works internally
- Key configuration parameters and their effects
- How to tune for throughput vs latency
- Memory management and monitoring strategies
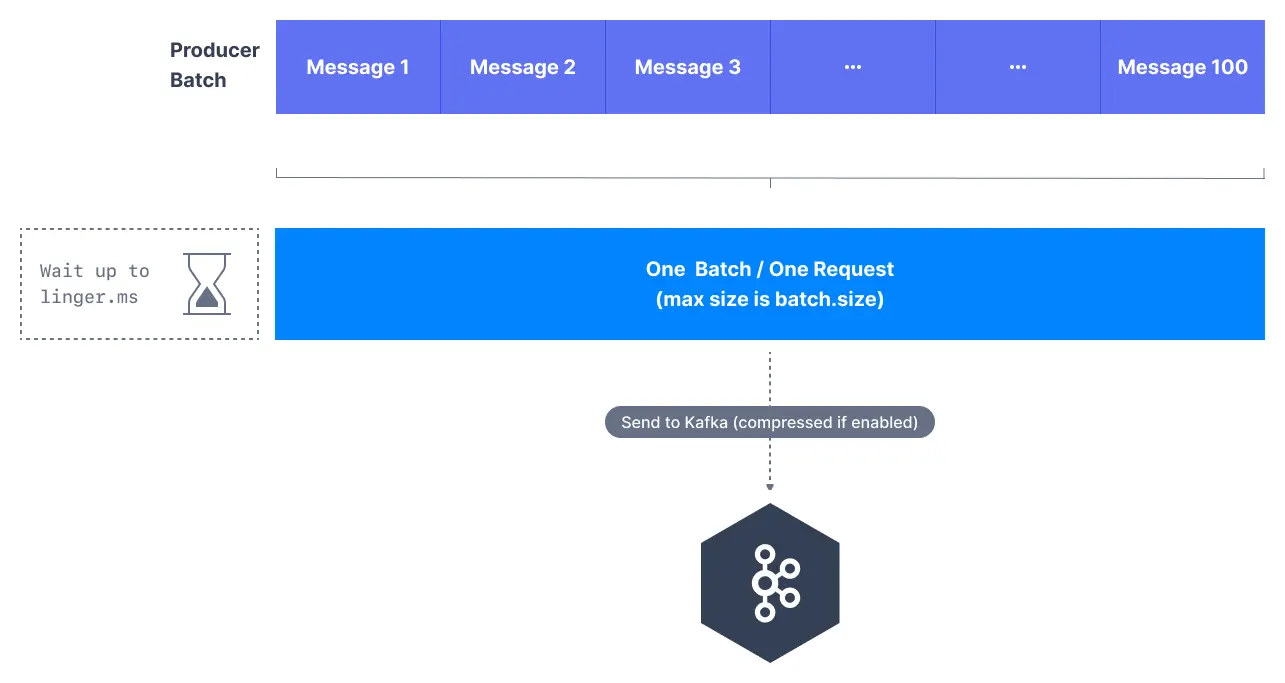
How batching works
Instead of sending messages individually, the Kafka producer accumulates messages in memory and sends them in batches:- Message accumulation: Producer collects messages in memory buffers per partition
- Batch creation: Messages are grouped into batches based on size or time limits
- Network transmission: Complete batches are sent to brokers in single network requests
- Broker processing: Brokers process entire batches more efficiently than individual messages
Key batching parameters
batch.size
Controls the maximum size of a batch in bytes.- Larger batches improve throughput but increase memory usage
- Batches are sent when they reach this size, regardless of time
- Each partition has its own batch buffer
- Messages spread across many partitions reduce per-partition batch efficiency — this is why the sticky partitioner was introduced
linger.ms
Controls how long to wait for additional messages before sending a batch.- Adds artificial delay to allow batches to fill up
- Improves throughput by creating larger batches
- Increases end-to-end latency slightly
buffer.memory
Total memory available for batching across all partitions.- Shared across all partitions and topics
- Producer blocks when buffer is full
- Must accommodate batch.size × number of active partitions
When batches are sent
Batches are sent when ANY of these conditions are met:| Condition | Description |
|---|---|
| Batch size reached | Batch reaches batch.size bytes |
| Linger time elapsed | linger.ms milliseconds have passed |
| Buffer full | Producer needs space for new messages |
| Producer flush | Explicit flush() call or producer close |
Tune for throughput vs latency
Decision guide
High-throughput configuration
Low-latency configuration
Balanced configuration (recommended)
Memory management
Memory allocation formula
buffer.memory=32MB,batch.size=16KB- Available batches = 32MB / 16KB = 2,048 batches
Memory pressure handling
When buffer memory is exhausted:send()calls block until memory available- After
max.block.ms, throwTimeoutException - Existing batches complete and free memory
Monitor batching performance
Key metrics
| Metric | Description | Target |
|---|---|---|
batch-size-avg | Average batch size | Close to batch.size |
records-per-request-avg | Messages per batch | Higher is better |
request-latency-avg | Batch send latency | Stable |
buffer-available-bytes | Free buffer memory | > 0 |
JMX monitoring path
Common issues and solutions
| Issue | Cause | Solution |
|---|---|---|
| Low batch utilization | linger.ms too low | Increase linger.ms |
| High memory usage | Too many partitions | Reduce batch.size or increase buffer.memory |
| Increased latency | linger.ms too high | Decrease linger.ms |
| Producer blocking | Buffer exhausted | Increase buffer.memory or reduce send rate |
batch.size parameter is a target, not a strict limit. Batches can exceed this size if single messages are larger, and will be smaller if linger.ms timeout occurs first.
See it in practice with ConduktorConduktor Console lets you produce test messages and observe batching behavior. Monitor producer metrics to validate your batching configuration works as expected.
Next steps
- Configure compression to reduce batch sizes
- Understand producer acks for durability
- Enable idempotent producers for exactly-once semantics