- identify configuration issues before they become outages,
- optimize storage costs,
- track governance metrics,
- monitor business-critical topics.
Overview
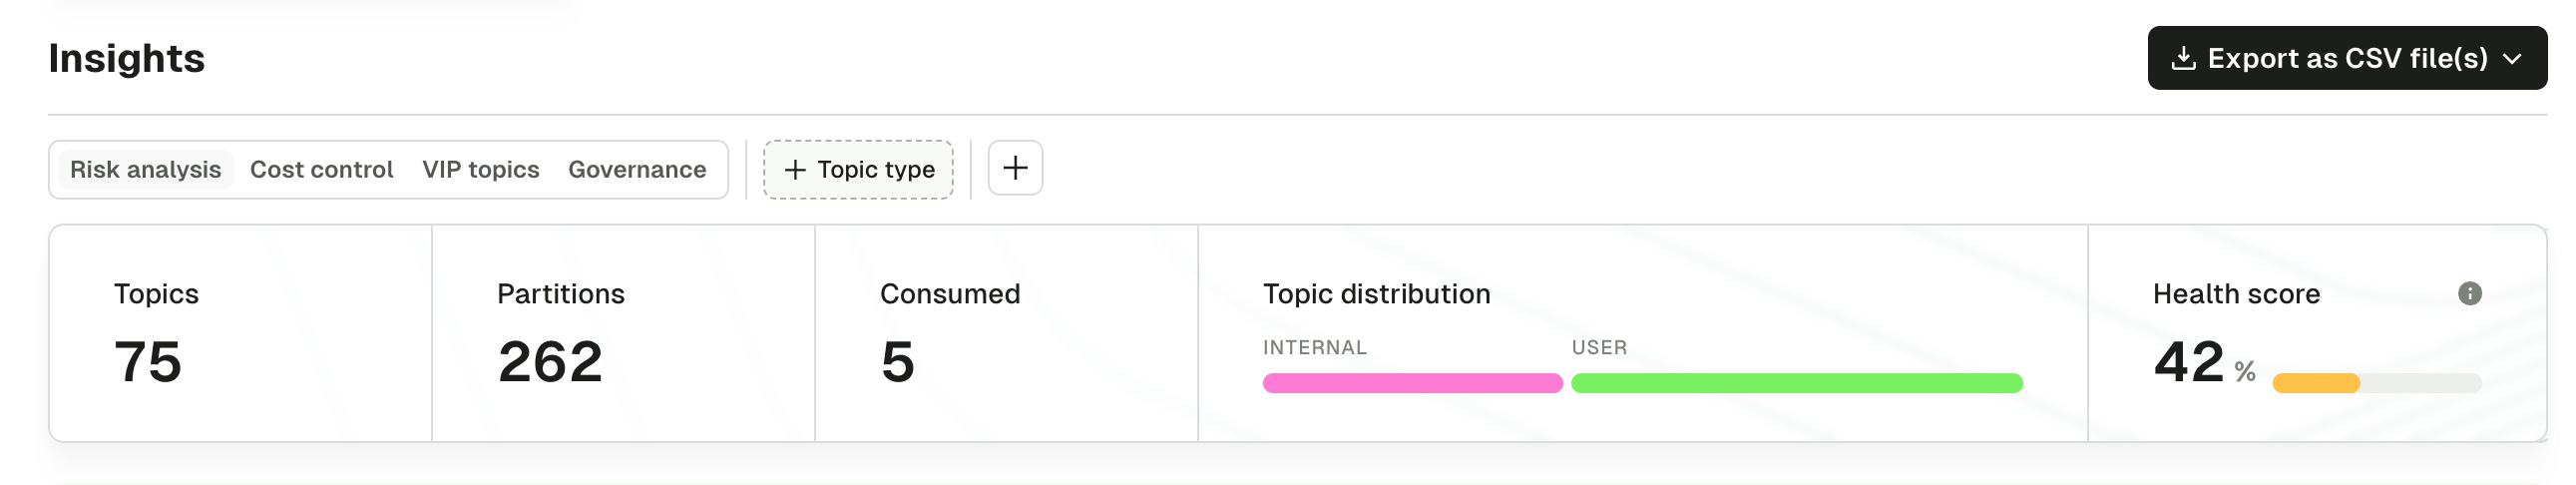
Insights covers four key areas:Risk analysis
Identify topics at risk of data loss, poor cluster efficiency or load imbalance.
Cost control
Find empty, stale or tiny topics.
VIP topics
Track usage of highly utilized topics.
Governance
Track schema adoption, serialization formats and Self-service coverage for your VIP topics.
Access to Insights
Access to the Insight information is managed by the RBAC system in Console. The insight information a user sees is based on the permission to view or edit the configuration for a topic. All insight views are filtered to only show data aggregated across topics where a user has these permissions.Metrics summary
At the top of the dashboard you’ll see a cluster-wide summary of all the metrics:- Topics - the number of topics in the cluster
- Partitions - an aggregate partition count across all topics
- Consumed - the total number of times topics are consumed by consumer groups
- Topic distribution - a breakdown of topics by type (internal, streams or user)
- Health score - the cluster health indicator based on our risk analysis
Filter data
Use the filter at the top of the Insights dashboard to narrow down data across all sections. Filters apply globally to the summary metrics, risk analysis, cost control and VIP topics sections. Filter topics by their classification:- Internal - internal topics (e.g.,
__consumer_offsets) - Streams - Kafka Streams internal topics (e.g., changelog, repartition topics)
- User - application topics created by you
- prefix -
my-topics*or justmy-topicswill filter to all topics whose names starts with “my-topics” - postfix -
*my-topicswill filter to all topics whose name ends with “my-topics” - contains -
*my-topics*will filter to all topics whose name contains “my-topics”
Clicking a label in any table also applies it as a filter, making it easy to explore related topics.
Export data
You can export data as a .zip file containing CSV files. Choose whether to export all available Insights data or only section-specific metrics. When filters are applied, the export includes only the filtered data and file names include a-filtered suffix (e.g., risk-analysis-filtered.csv) to indicate the data is a subset of the full cluster.
Share the export with stakeholders, use it for offline analysis, or archive it for audit purposes.