Overview
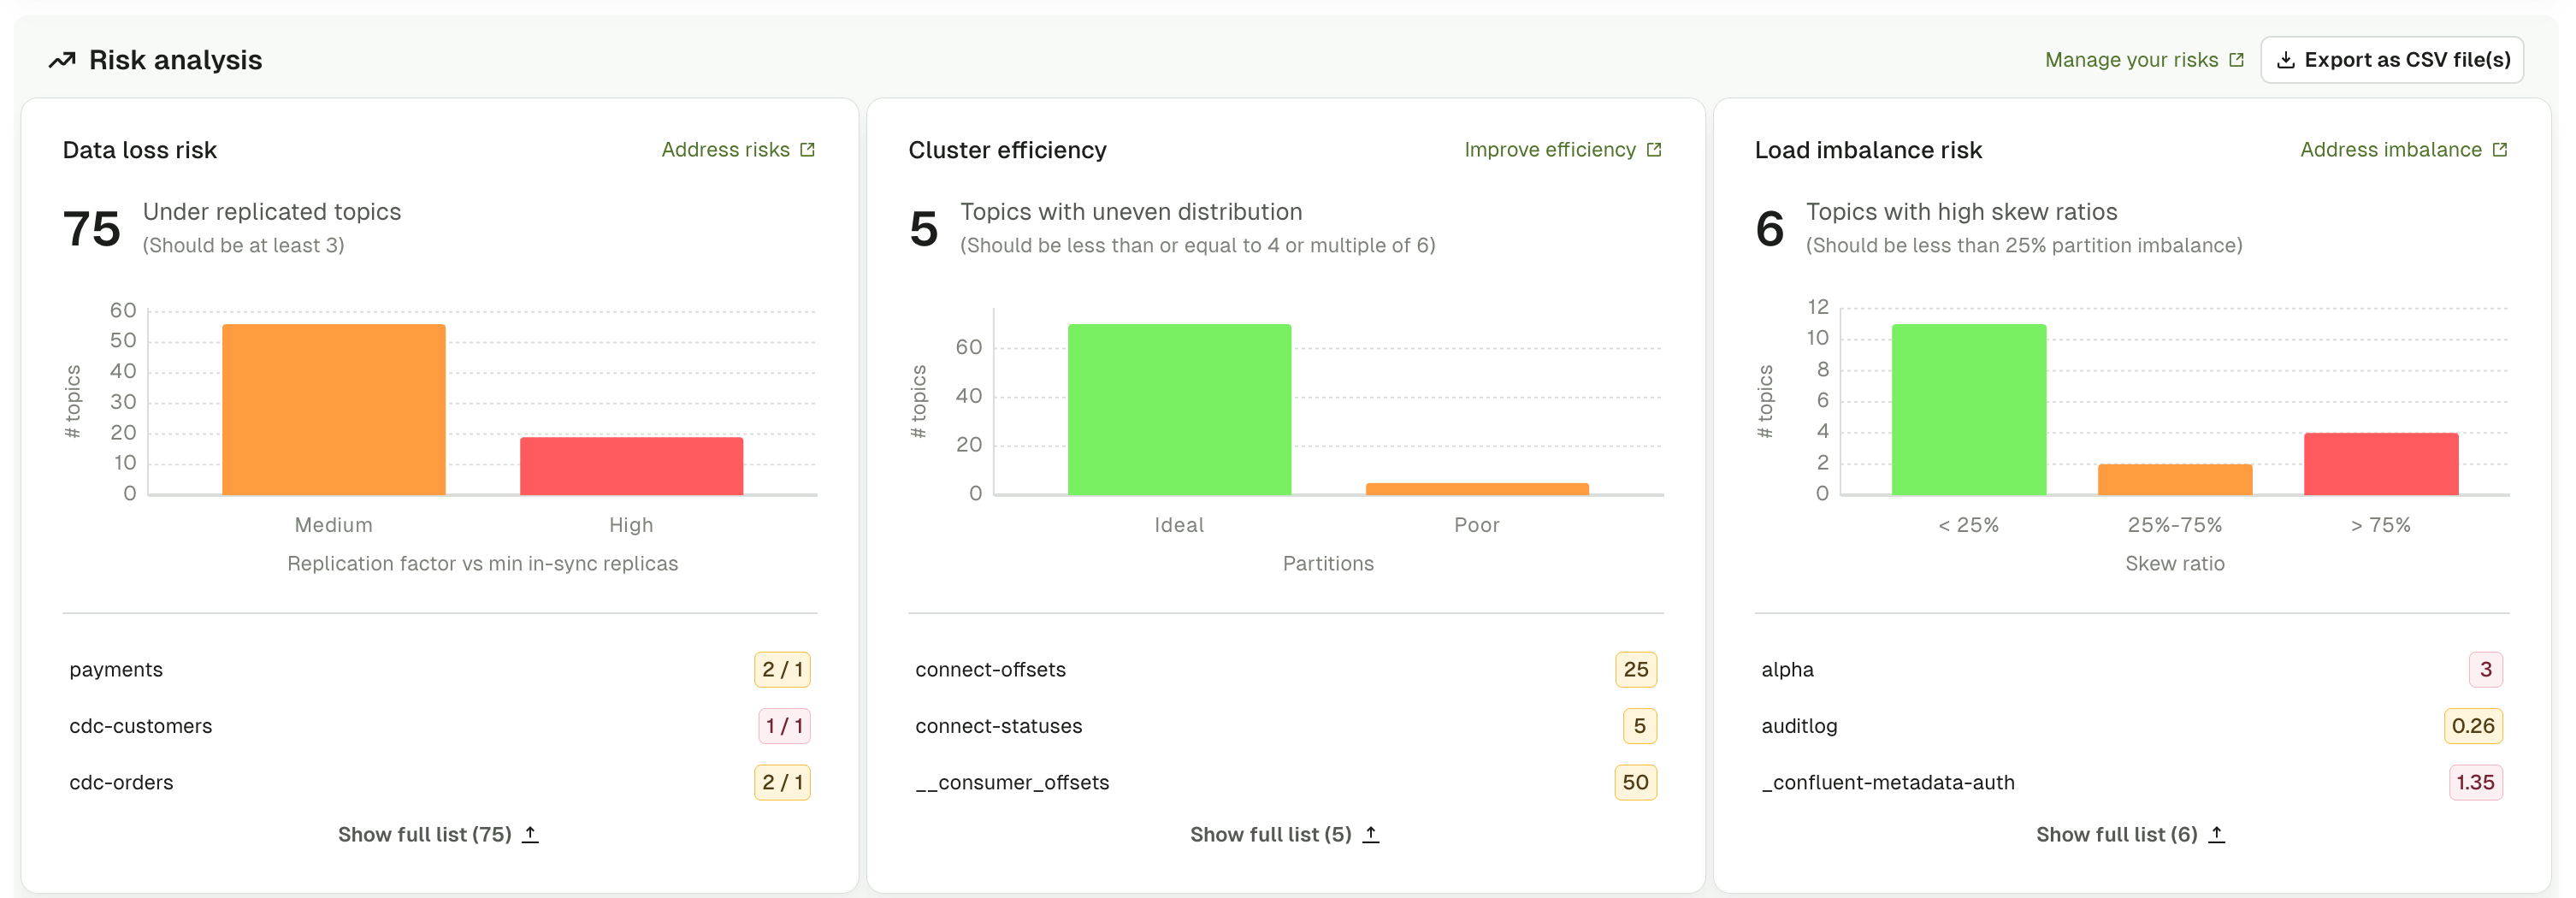
Risk analysis monitors three critical aspects of topic configuration:- Data loss risk: topics with insufficient data redundancy based on replication factor (RF) and min in-sync replicas
- Cluster efficiency: topics with sub-optimal partition allocation across brokers
- Load imbalance risk: topics with uneven data distribution across partitions
- Red: high risk requiring immediate attention
- Orange/Yellow: medium risk that should be addressed
- Green: low risk or healthy configuration
What the graphs show
Data loss risk
The data loss risk graph displays topics categorized by their vulnerability to data loss based on a combination of the replication factor (RF) and min in-sync replicas configuration. Topics are classified into three risk levels:- High risk (red): topics with RF = 1 (no data redundancy). If the broker hosting the topic fails, all data becomes unavailable permanently.
- Medium risk (orange): topics with RF = 2, or topics with RF > 2 but min.insync.replicas < RF-1. Limited fault tolerance or insufficient write durability guarantees.
- Low risk (green): topics with RF ≥ 3 and min.insync.replicas = RF-1. Provides adequate fault tolerance and write durability for production environments.
Resolve data loss risk
Identify the topic with low replication factor:- Go to the topic - go to Topics from the main menu and select the topic shown in the graph.
- Review current configuration - click the Configuration tab and note the replication factor shown at the top of the page to confirm the current value. Replication factor is a topic-level setting that can’t be changed after topic creation through normal configuration updates.
- Partition reassignment
- Recreate topic
Partition reassignment allows you to add replicas to existing topics without recreating them. This operation requires Kafka administrative tools external to Console:
- Document current partition assignment - in Console, go to the topic and click the Partitions tab. Document the current replica assignments for all partitions.
-
Perform partition reassignment - use Kafka administrative tools (such as
kafka-reassign-partitions) to add additional replicas to the topic. This process replicates data across additional brokers in the background.Partition reassignment requires creating a JSON file specifying new replica assignments and executing the reassignment using Kafka CLI tools. Set throttling limits to avoid impacting cluster performance during the operation. - Verify completion in Console - return to the Partitions tab in Console and verify all partitions now show the increased replication factor.
default.replication.factor=3 in broker configuration and configure min.insync.replicas=2 to ensure writes are acknowledged by at least two replicas.
Use RBAC permissions to prevent users from creating topics with RF < 3.
Cluster efficiency
The cluster efficiency graph displays topics categorized by partition allocation patterns that affect broker load distribution and resource utilization. Topics are classified into two categories:- Ideal (green): topics with fewer partitions than the number of brokers in the cluster, or topics with partition counts which are a multiple of the number of brokers. These partition counts distribute evenly across typical broker configurations.
- Poor (orange): topics with more partitions than there are brokers, and where the partition count is not divisible by the broker count. These configurations may create uneven distribution across brokers, leading to hotspots and suboptimal resource utilization.
Resolve cluster efficiency issues
Analyze current distribution:- Go to the topic - go to Topics and select the affected topic.
- Review partition distribution - click the Partitions tab and examine the distribution across brokers.
-
Switch views - toggle between Per partition and Per broker views to understand the distribution pattern.
Per broker view shows:
- Which brokers lead which partitions
- Which brokers hold follower replicas
- Imbalances in partition leadership
-
Identify rebalancing needs - look for:
- Brokers with significantly more leader partitions than others
- Brokers with no partitions for critical topics
- Uneven distribution patterns that could cause hotspots
- Rebalance leadership
- Reassign replicas
- Add partitions
Use Kafka administrative tools to trigger preferred leader election, which reassigns leadership to each partition’s preferred leader without moving data.This lightweight operation is safe for production and should be run regularly.
Preferred leader election only changes which broker is the leader for each partition. It does not move data or change replica assignments.
Load imbalance risk
The load imbalance risk graph displays topics with uneven data distribution across partitions, measured by partition skew percentage. High partition skew causes performance problems (hot partitions, consumer lag), resource inefficiency (wasted parallelism, uneven disk usage) and may indicate poor partition key selection or producer misconfiguration. Topics are categorized by skew percentage:- < 25% (green): slight imbalance with acceptable variation in partition sizes
- 25% - 75% (orange): moderate imbalance that should be monitored and investigated
- > 75% (red): severe imbalance requiring immediate attention to prevent performance issues
Possible causes
Poor partition key selection - keys with uneven distribution, too few unique keys, or clustering around certain values. Producer configuration issues - manual partition assignment, custom partitioner with flawed logic, or null keys. Data model problems - business logic creating natural hotspots, temporal patterns, or geographic clustering.Resolve load imbalance
Diagnose the skew:- Go to the topic - go to Topics and select the affected topic.
- Review partition details - click the Partitions tab and select the Per partition view.
-
Identify imbalanced partitions - compare the following columns across all partitions:
- Total number of records - Shows message count per partition
- Partition size - Shows disk space consumed
- Begin offset and End offset - Shows the range of messages
- Document the pattern - note which partitions are oversized and by how much. This will help identify the root cause.
- Go to the Consume tab - click the Consume tab for the topic.
- Configure consumer settings - configure the consumer to read from All partitions to see the full data distribution.
-
Review message keys - examine the keys in the consumed data. Look for patterns:
- Are certain keys appearing far more frequently than others?
- Are many messages using null keys?
- Is there visible clustering in key values?
- Filter by partition - use the partition filter to consume from specific partitions (especially the largest and smallest) to compare key distributions.
- Fix partition key (recommended)
- Increase partitions
- Recreate topic
Choose keys with high cardinality and even distribution:Good choices:
- User ID, Order ID, Transaction ID, Device ID
- Composite keys like
${region}-${customerId} - Any identifier with naturally even distribution
- Status fields (limited values)
- Boolean values (only two values)
- Small enums (limited set of values)
- Dates without time component
- Null keys
Changing the partition key requires updating producer applications. Coordinate with your development team to implement the new key strategy.
Set up alerts for partition size differences and review the Risk Analysis dashboard regularly. Monitor consumer lag by partition to identify performance impacts.
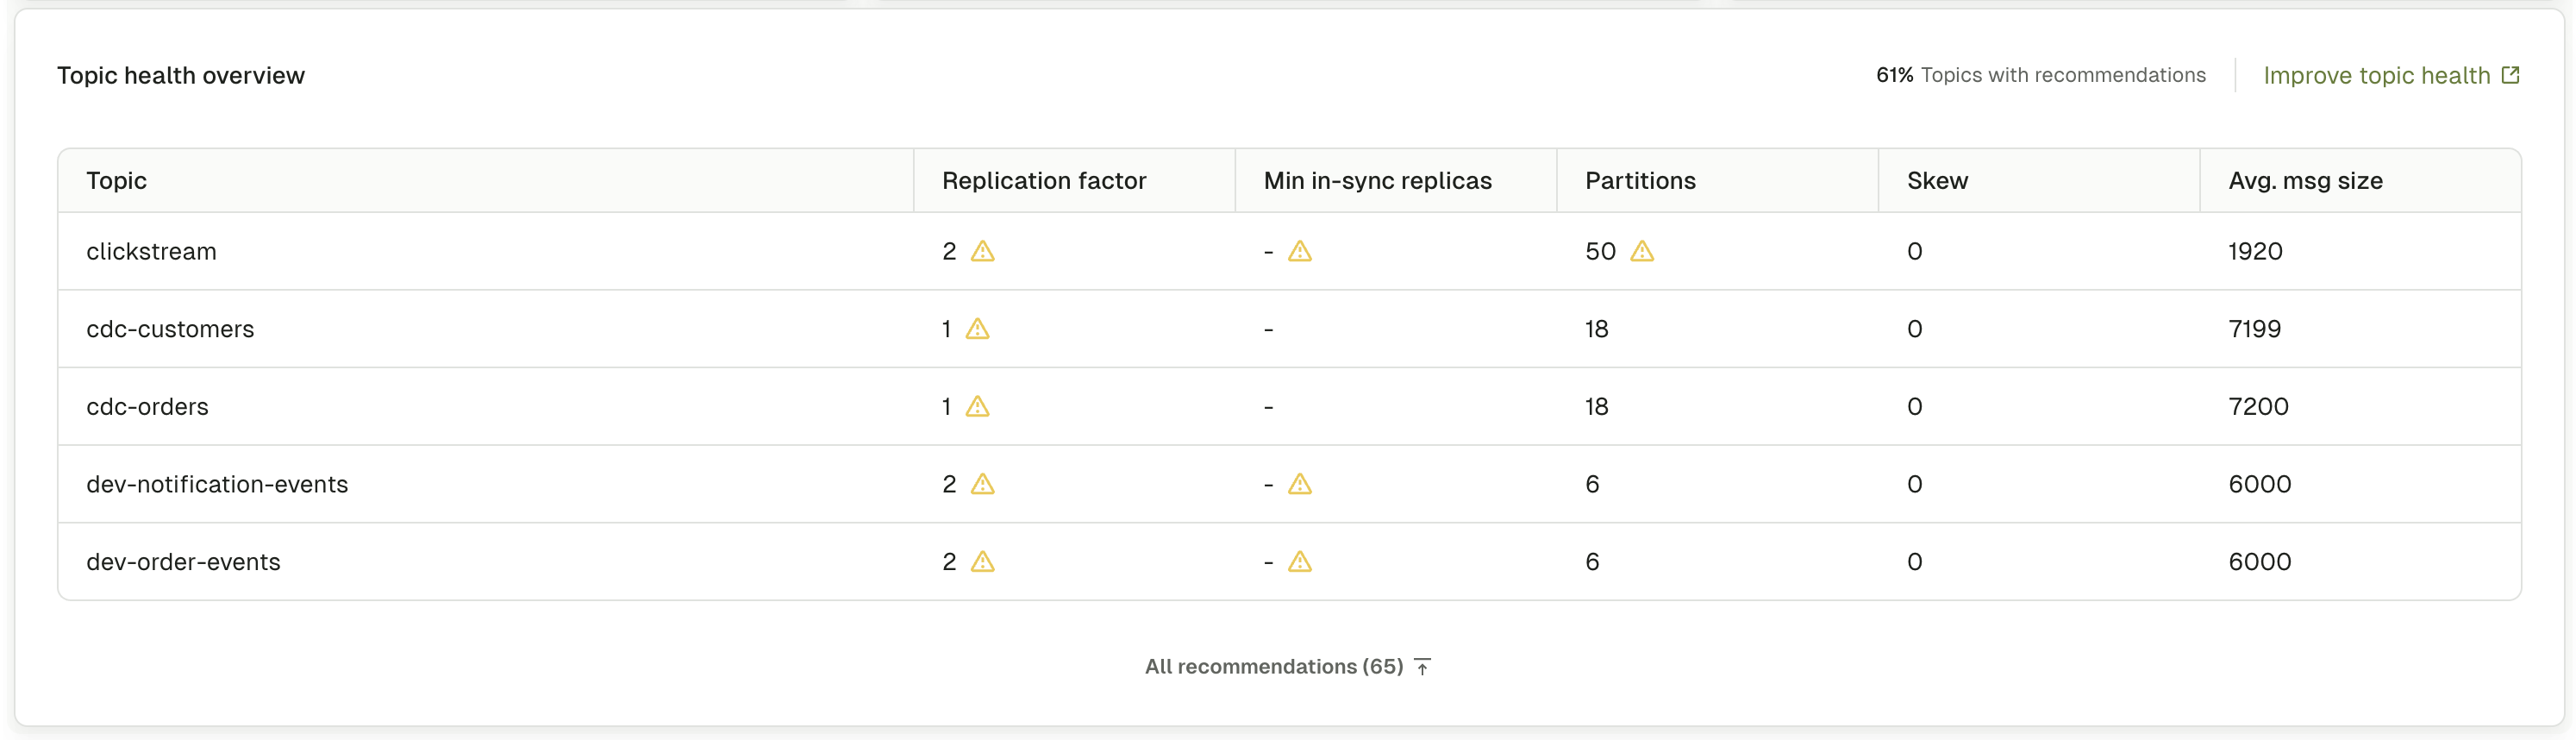
Table view
The topic health overview table, seen when you toggle graphs off with the control at the top of the page, provides a detailed view of topics that need attention. It displays key configuration metrics and warning indicators.- Topic: topic name with topic type label (internal, streams, or user) and any custom labels
- Min in-sync replicas: minimum number of replicas that have to acknowledge writes
- Partitions: total partition count for the topic
- Avg. msg size: average message size in bytes
- Replication factor: number of replicas for each partition
- Skew: partition imbalance percentage showing data distribution
Sort and search
Use the search box to filter topics by name. Click any column header to sort the table by that column in ascending or descending order.Clicking a topic type or label in the table applies it as a global filter across all Insights sections.
Warning indicators
Topics display warning indicators when they meet the following thresholds:- Average message size > 600KB - Large messages that may cause performance issues
- Replication factor < 3 - Insufficient redundancy for production environments
- Skew > 75% with at least 1000 messages per partition - Severe partition imbalance requiring attention
Troubleshoot
Why does my topic show high load imbalance even with good partition keys?
Why does my topic show high load imbalance even with good partition keys?
Several factors can cause imbalance even with well-designed partition keys:
- Time-based patterns: Temporal clustering (business hours vs. night) creates natural imbalance based on when data was produced
- Compaction: Log compacted topics retain more messages in partitions with higher key diversity
- Retention: Uneven produce rates over time mean partitions contain data from different periods
- Producer failures: Restarts or errors may temporarily cluster messages on specific partitions
- Natural data distribution: Some business scenarios naturally create imbalance (one customer generating 80% of orders)
Can I fix replication factor without recreating the topic?
Can I fix replication factor without recreating the topic?
Yes, use partition reassignment to add replicas to existing topics through Kafka administrative tools:
- View current replica assignments in Console’s Partitions tab
- Create a reassignment plan specifying new replica assignments with additional broker IDs
- Execute the reassignment using Kafka CLI tools (data replicates in the background)
- Monitor progress and verify completion in Console
How many partitions should my topic have?
How many partitions should my topic have?
Key considerations:
- Throughput: More partitions = more parallelism and higher potential throughput
- Consumer count: You need at least as many partitions as consumers for full parallelism
- Broker count: Choose a partition count that’s a multiple of broker count for even distribution
- Message ordering: Ordering is only guaranteed within a single partition
- Overhead: Each partition adds metadata overhead. Tens of thousands of partitions can cause performance issues
- Low-volume topic: 1-4 partitions
- Standard topic: 6 or 12 partitions
- High-throughput topic: 18, 24, 30 or more partitions (multiples of 6)
Why do I see load imbalance immediately after topic creation?
Why do I see load imbalance immediately after topic creation?
This is normal and expected for newly created topics. Initial messages create imbalance as partitions receive different amounts of data before distribution stabilizes.Expected behavior:
- First 100-1000 messages: High imbalance is normal
- After 1000+ messages: Imbalance should normalize if partition keys are well-distributed
- After 24-48 hours: Imbalance percentages should stabilize
What's the performance impact of partition reassignment?
What's the performance impact of partition reassignment?
Partition reassignment impacts network traffic, disk I/O, client latency, and broker CPU. Duration depends on data volume: small topics (< 1 GB) complete in minutes; large topics (> 1 TB) can take hours or days.Best practices to minimize impact:
- Schedule during low-traffic periods
- Use throttling to prevent saturating network bandwidth
- Monitor cluster metrics (CPU, disk I/O, network throughput, client latency) using Console
- For very large topics, reassign partitions in batches
- Adjust throttle dynamically based on traffic patterns
- Remove throttle after completion
What's the difference between under-replicated partitions and under min ISR partitions?
What's the difference between under-replicated partitions and under min ISR partitions?
These are related but different conditions:Under-replicated partitions:
- A partition has fewer in-sync replicas than its configured replication factor
- Caused by broker failures, network issues or replicas falling behind
- Reduces fault tolerance but doesn’t immediately block writes
- Example: Topic with RF=3 but only 2 replicas are in-sync
- The number of in-sync replicas falls below the
min.insync.replicassetting - Blocks producers configured with
acks=allfrom writing - More severe condition indicating immediate data durability risk
- Example:
min.insync.replicas=2but only 1 replica is in-sync
A partition can be under-replicated without being under min ISR (if enough replicas remain in-sync to meet the minimum). However, under min ISR partitions are always also under-replicated.