Conduktor offers real-time statistics that provide insights into the most important Kafka metrics. Graph You can then set up alerts to get notified about the metrics that matter to you.

Prerequisite

Deploy and configure Cortex to enable monitoring and seamlessly integrate it with your existing systems.

Ops monitoring

Operations monitoring enhances understanding of your Kafka infrastructure health, allowing you to monitor:
  • cluster health state,
  • partitions health state,
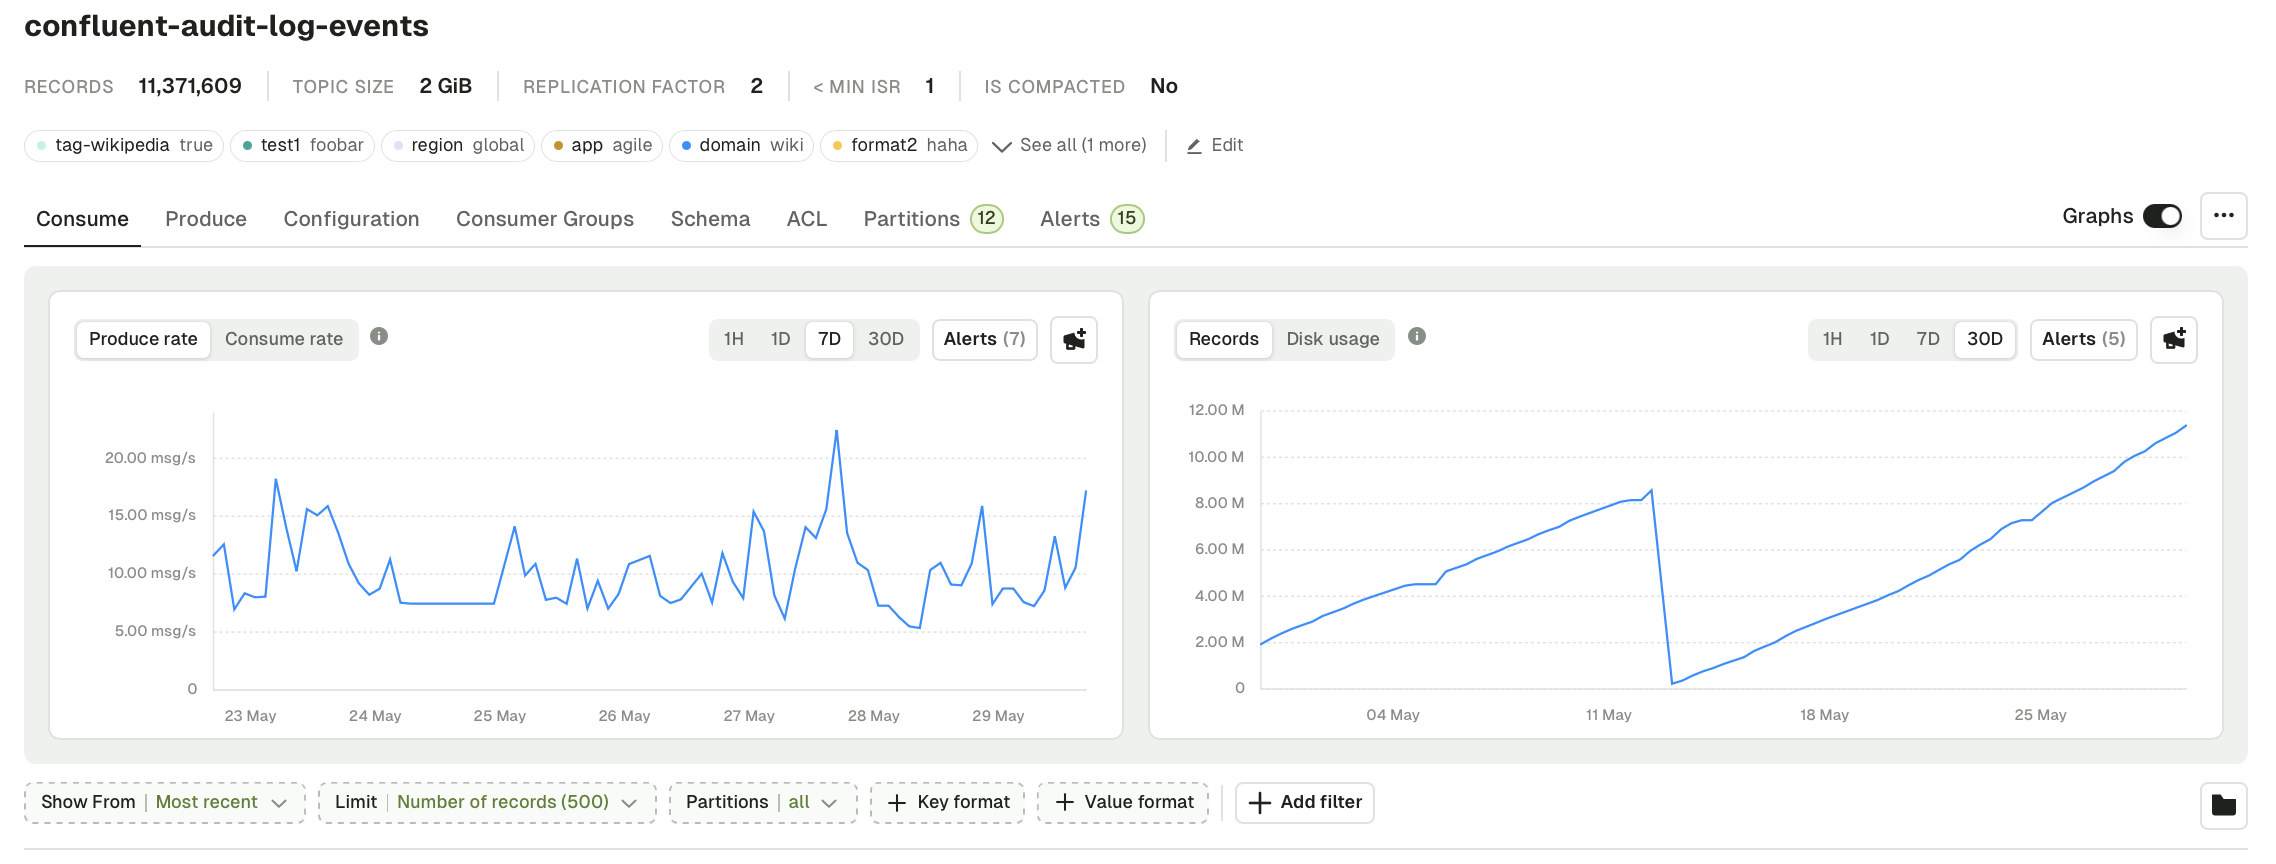
  • topic activity, storage,
  • and more.

Application monitoring

Application monitoring enhances your understanding of your Kafka applications, by monitoring:
  • consumer group states and
  • consumer group lag

Monitoring metrics

ContextMetricDescription
Apps monitoringConsumer group statusIndicates healthy or critical status based on lag.
Critical if max lag/s exceeds 180.
Apps monitoringLag message countNumber of messages each consumer group is behind per partition.
Apps monitoringLag(s)Estimated number of seconds that each consumer group is behind in the topic.
Cluster healthMessages count
per broker (s)
This metric gives you the ability to gauge how active your producers are. Given batching and other factors this metric will change over time.
Cluster healthMessages in
per broker (B/s)
This metric provides the amount of bandwidth per broker that’s been taken up by producers as well as replication from partitions the broker leads in your cluster. This is useful for planning well distributed leader placement.
Cluster healthMessages out
per broker (B/s)
This metric indicates how much bandwidth per broker is being utilized by consumers, as well as for replication to the broker. This is useful for planning replica and leader placements.
Cluster healthOffline partitions countOffline partitions can be caused by lingering capacity issues, crashed brokers or cluster-wide faults. This is a critical factor in the health of your cluster - an offline partition can’t be produced to or consumed from. If the controller believes a partition is offline, it may not re-assign or bring online a leader.
Cluster healthUnder-replicated partitions countPartitions that are under-replicated are a risk to data durability and availability. Under-replicated partitions can happen for various reasons, including an inability for replicas to keep up or network splits.
Cluster healthUnder min ISR partitions countUnder minimum ISR partitions don’t meet the durability requirements to be produced to. If producers that try to produce messages to a partition that’s under the specified minimum, ISR will reject the messages and will be forced to handle the exception.
Cluster healthDisk - FS usageIf a Kafka broker fills up, its disk durability and availability means that data is at risk. Producers will also be unable to produce to that broker. Filling a broker’s disk is also a hard incident to recover from and often involves loss of data.
Cluster healthPartitions countTotal number of partitions (including replicas) across the selected Kafka cluster.
Cluster healthActive brokers countNumber of active brokers on the selected Kafka cluster.
Cluster healthActive partitions countTotal number of partitions active on the selected Kafka cluster.
Cluster healthActive controllers countTotal number of active controllers on the selected Kafka cluster.
Topic monitoringMessages count per topic (/s)Number of messages produced per second, per broker at a topic granularity.
Topic monitoringTopic traffic in (B/s)Byte rate per second of messages produced, per broker at a topic granularity.
Topic monitoringTopic traffic out (B/s)Byte rate per second of messages consumed, per broker at a topic granularity.
Topic monitoringTotal size of messagesTotal size of messages in the topic.