Obtain a license
How you obtain a license depends on the type:- Enterprise — for production deployments running Console, Gateway or both. The same key applies to both products. Contact Conduktor sales to start the process.
- Console Community Edition — free, no license key needed. Console runs in Community Edition when no
CDK_LICENSEenvironment variable is set. See what’s included in Console Community Edition.
Apply your license
We recommend applying your license to the environment variables. Alternatively, you can add it to your YAML config file.- Environment variables
- YAML file
.env
Verify your license
Use Console to check that your license has been applied correctly. You can do this via the UI or by checking the logs.Use the UI
Log into Conduktor Console then go to Settings > Plan: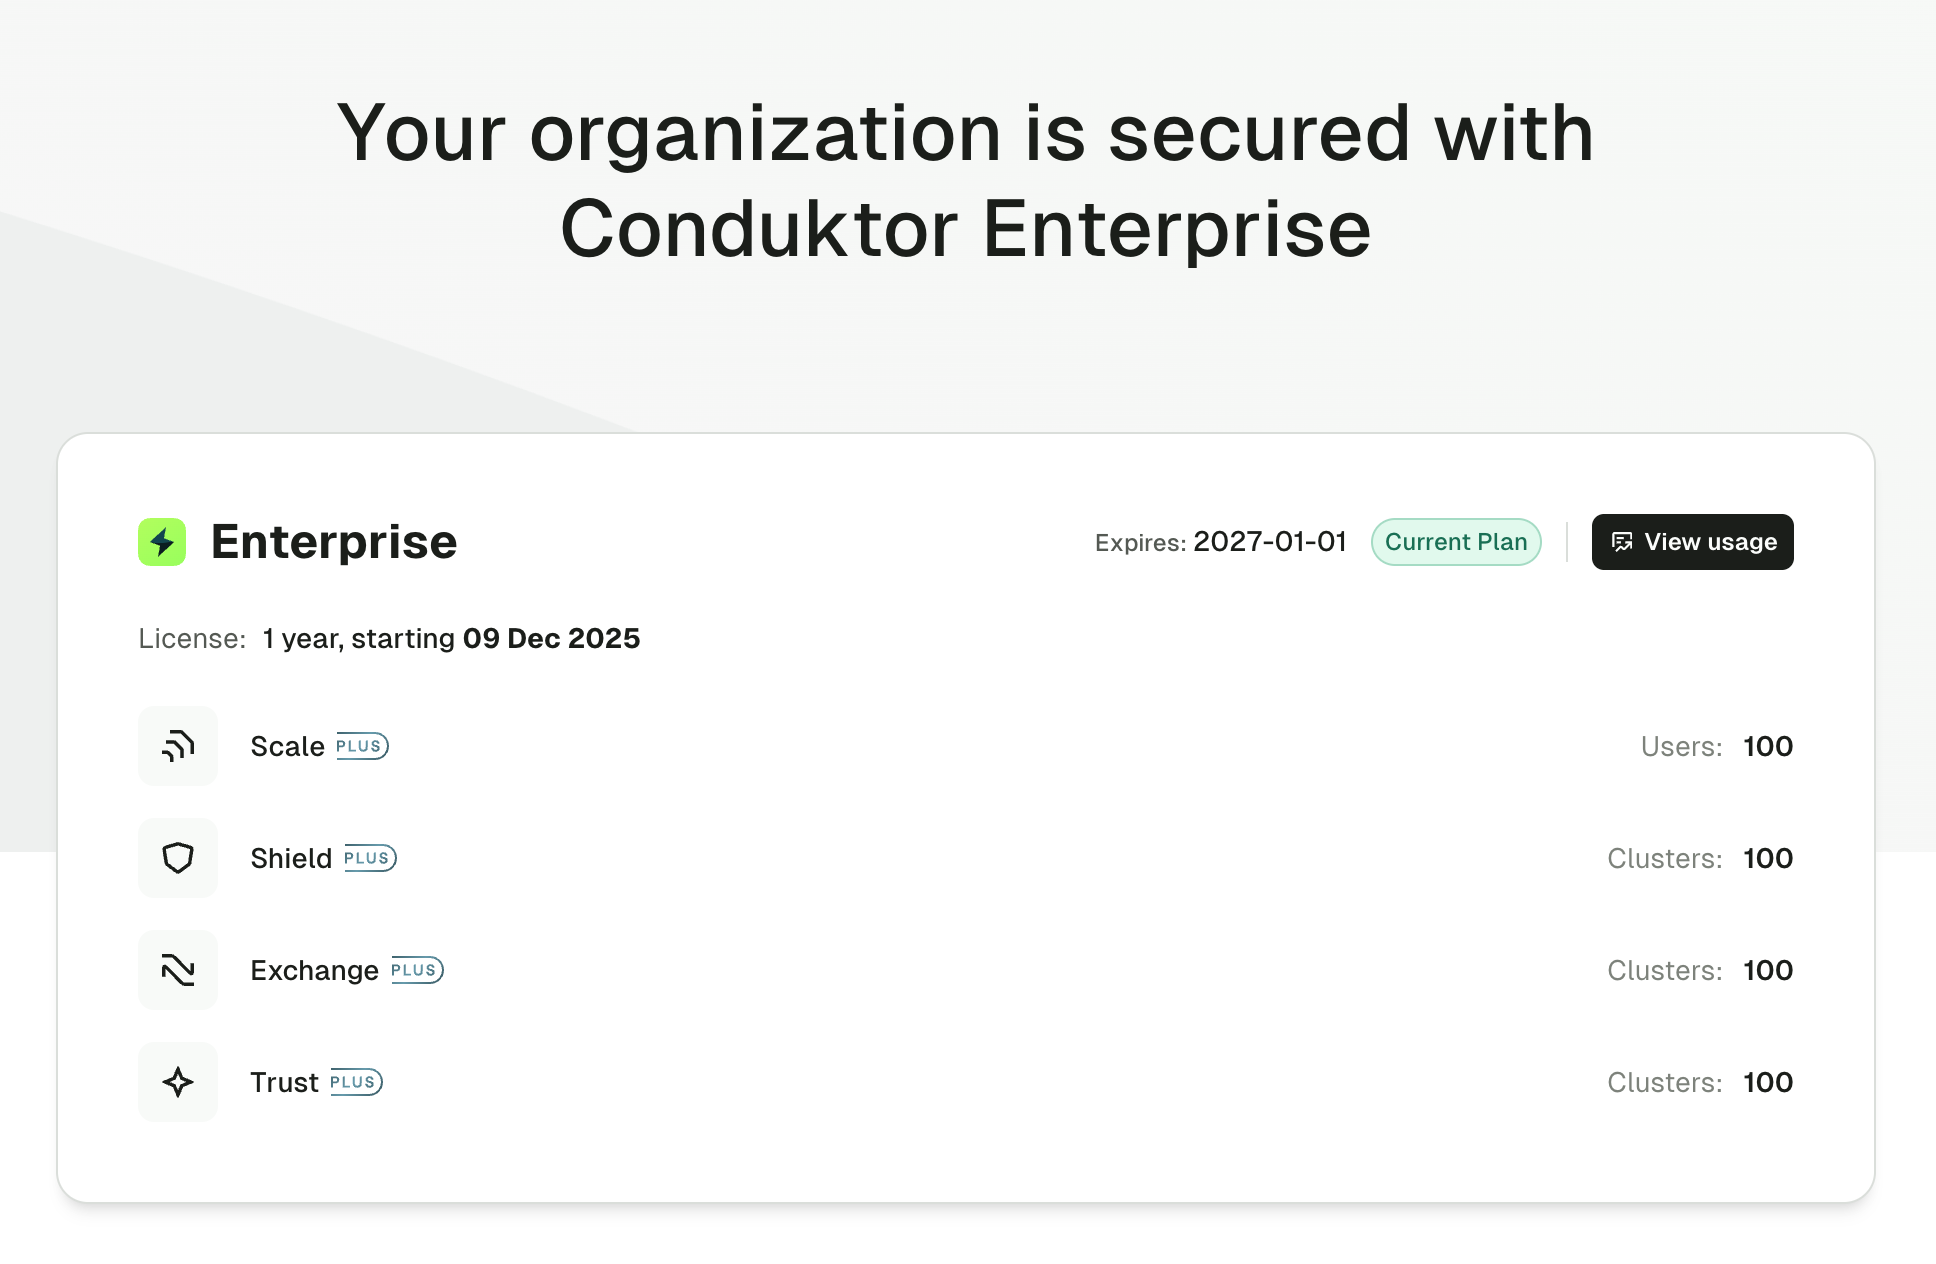
Use the logs
Run Console then check the top of the startup logs:License Enterprise is valid until 2026-01-01 00:00:00.
Renew or update your license
To renew an existing or apply a new license, change theCDK_LICENSE value in the environment variables (or the license value in the YAML file, depending on your setup) and re-deploy the Conduktor Console container.
Monitor license expiration
Console exposes a Prometheus metric to track the number of days remaining before license expiration:console_license_remaining_days.
You can set up monitoring alerts on this metric to proactively manage license renewals. Check out the metrics reference.
Track Console usage
Usage data allows you to monitor Console usage and license utilization. You can see all active users, view Self-service applications and instance usage, view access requests and see the total number of Partner Zones and shared topics.Usage data is accessible to admin users only.
View usage data
In Console, go to Settings > Plan to view your current license details. Click View usage to open the usage dashboard.Tracked metrics
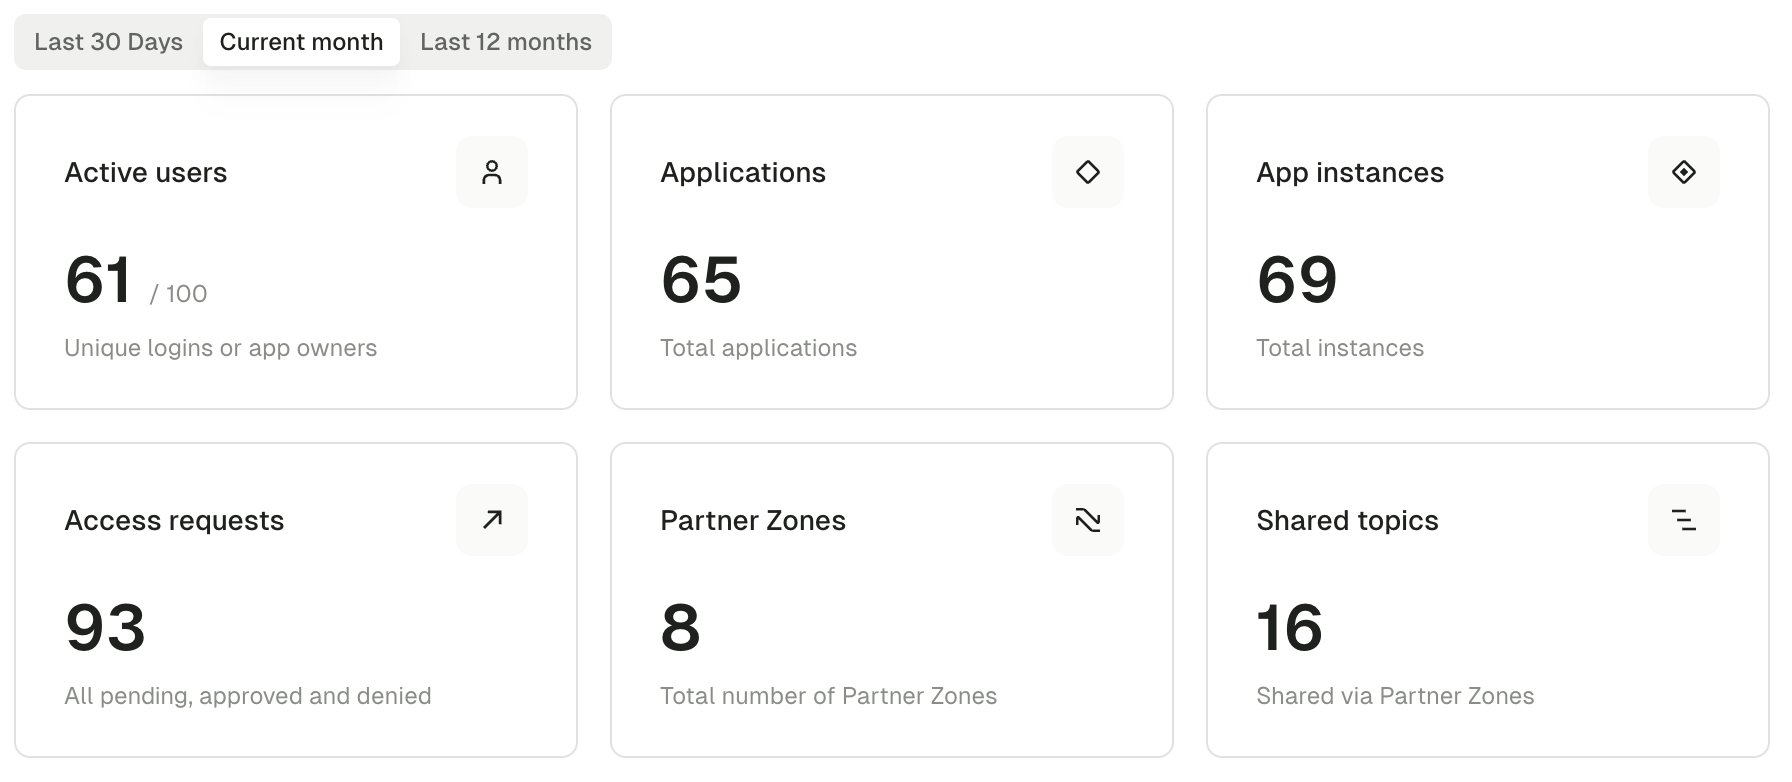
The active users graph displays monthly trends, showing how usage patterns change over time. When your license limit has been reached or surpassed, Console displays a warning indicator.
Time periods
The graph provides a visual overview of how Console usage has changed over time, helping you identify trends and plan for license capacity.- Last 30 days: rolling 30-day window from today
- Current month: month-to-date metrics
- Last 12 months: monthly aggregated data for the past year
Export usage data
Click Export CSV to download usage data for further analysis or reporting. The export includes metric names, values, time period information and a timestamp.Troubleshoot
My license allows a certain number of users to access Console. How are users defined?
My license allows a certain number of users to access Console. How are users defined?
Conduktor considers the user as being a distinct entry that’s stored in the users database, regardless of whether they’ve ever logged in/are attached to any existing groups or not. Entries are created in the users database when: the first admin account(s) are created, users are added via basic authentication or users log in via SSO (or are added explicitly to the Conduktor UI prior to their first login via SSO). To manage users, go to Settings > Users.
What happens if I exceed my user threshold?
What happens if I exceed my user threshold?
Conduktor employs a soft limit to ensure that your service is not disrupted in cases where you onboard more users than expected. We understand it can be difficult to plan in advance and ask you get in touch with your customer success team if you exceed your user threshold. Please note this limit is a contractual agreement between Conduktor and your company, and may be subject to auditing from time to time.
I can't see the last active date of a user, how can I perform a clean-up?
I can't see the last active date of a user, how can I perform a clean-up?
In Console, go to Settings > Users to review the last login time of each user.